
- Title
-
Preparation of β-lactoglobulin-derived tryptophan peptide and its effect on anxiety-like behaviors in Zebrafish
- Authors
- Zhu, X., Xie, D., Zhu, Q., Li, Y., Cui, C.
- Source
- Full text @ Front Nutr
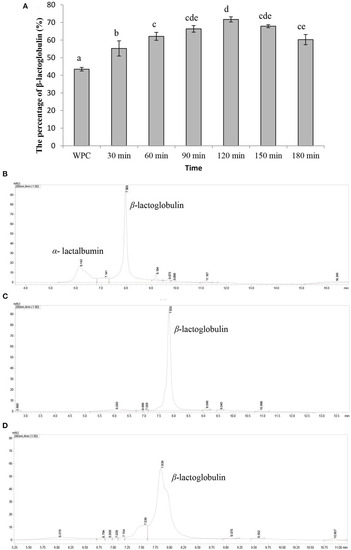
Characterization of β-lactoglobulin enriched. Data are expressed as the mean ± SD (n = 3), and ANOVA was performed to evaluate the difference, followed by the Duncan post-hoc test. (A) The percentage of β-lactoglobulin. Different letters indicate a significant difference (p < 0.05). (B) The UPLC spectra of whey protein. (C) The UPLC spectrum of whey protein hydrolyzed by acid protease for 120 min. (D) The UPLC spectrum of whey protein hydrolyzed by acid protease for 180 min. |
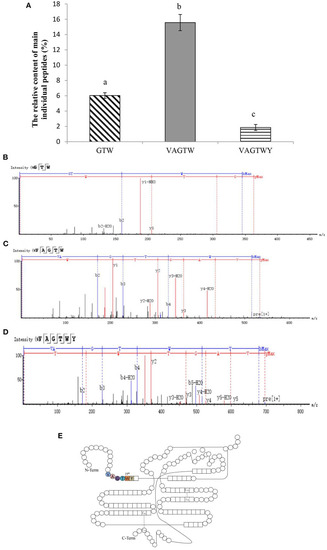
Characterization of Trp peptides obtained from β-lactoglobulin. Data are expressed as the mean ± SD, and ANOVA was performed to evaluate the difference, followed by the Duncan post-hoc test. (A) The relative content of peptides (GTW, VAGTW, and VAGTWT) produced from β-lactoglobulin. Different letters (a, b, and c) indicate a significant difference (p < 0.05). The UPLC-Q-TOF MS/MS tandem mass spectra (ESI+) of (B) GTW (Gly-Thr-Trp), (C) VAGTW (Val-Ala-Gly-Thr-Trp), and (D) VAGTWY (Val-Ala-Gly-Thr-Trp-Tyr) as interpreted by peaks automatic sequencing software. (E) Schematic diagram of the molecular structure of β-lactoglobulin. |
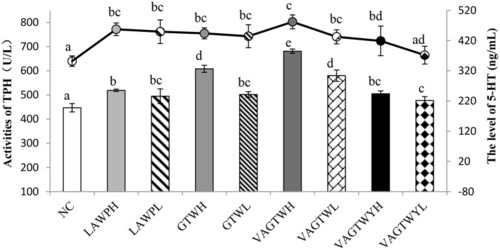
Effect of Trp peptides on the activity of THP and level of 5-HT in zebrafish. NC group (the normal control group for treatment with normal water); LAWPH (the group for treatment with β-lactoglobulin Trp peptides at a high dose: 500 μg/ml); LAWPL (the group for treatment with β-lactoglobulin Trp peptides at a low dose: 56 μg/ml); VAGTWYH (the group for treatment with Val-Ala-Gly-Thr-Tyr-Trp at a high dose: 500 μg/ml); VAGTWYL (the group for treatment with Val-Ala-Gly-Thr-Tyr-Trp at a low dose: 56 μg/ml); VAGTWH (the group for treatment with Val-Ala-Gly-Thr-Tyr-Trp at a high dose: 500 μg/ml); VAGTWL (the group for treatment with Val-Ala-Gly-Thr-Tyr-Trp at a low dose: 56 μg/ml); GTWH (the group for treatment with Gly-Thr-Trp at a high dose: 500 μg/ml); GTWL (the group for treatment with Gly-Thr-Trp at a low dose: 56 μg/ml). Data are expressed as the mean ± SD (n = 30), and ANOVA was performed to evaluate the difference, followed by the Duncan post-hoc test. The bar graph and the line graph show the activities of TPH (the left ordinate) and the level of 5-HT (the right ordinate), respectively. Different letters indicate a significant difference (p < 0.05). |