
Image
|
Figure Caption
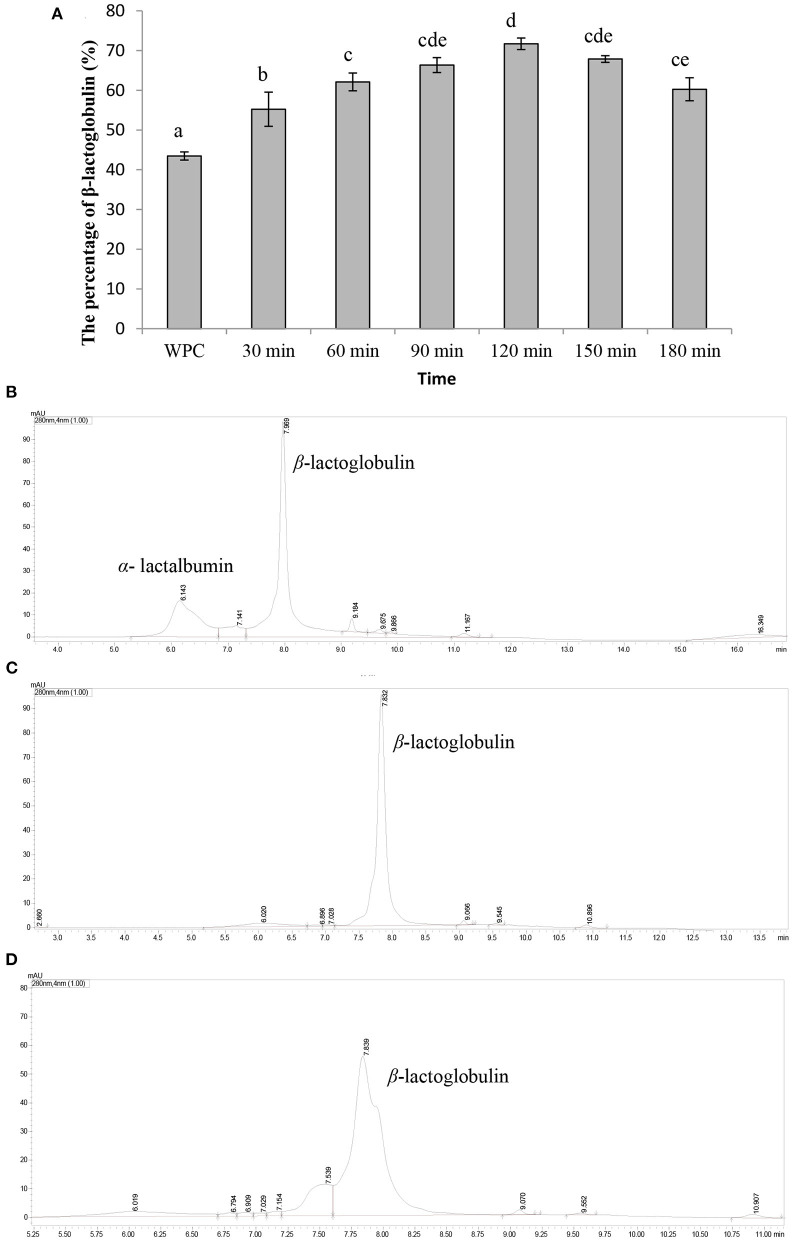
Figure 1
Characterization of β-lactoglobulin enriched. Data are expressed as the mean ± SD (n = 3), and ANOVA was performed to evaluate the difference, followed by the Duncan post-hoc test. (A) The percentage of β-lactoglobulin. Different letters indicate a significant difference (p < 0.05). (B) The UPLC spectra of whey protein. (C) The UPLC spectrum of whey protein hydrolyzed by acid protease for 120 min. (D) The UPLC spectrum of whey protein hydrolyzed by acid protease for 180 min.
Acknowledgments
This image is the copyrighted work of the attributed author or publisher, and
ZFIN has permission only to display this image to its users.
Additional permissions should be obtained from the applicable author or publisher of the image.
Full text @ Front Nutr