
|
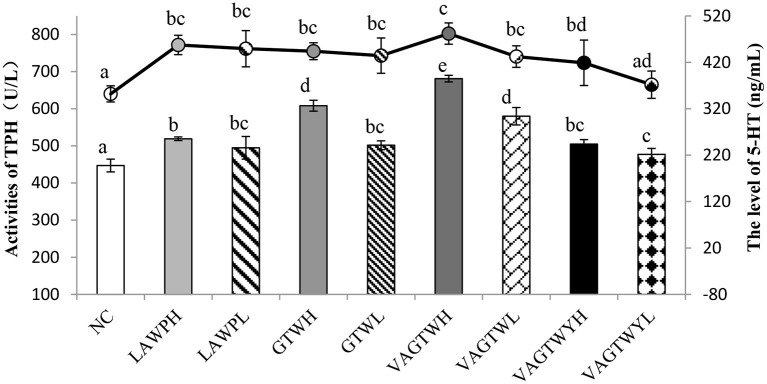
Figure 3
Effect of Trp peptides on the activity of THP and level of 5-HT in zebrafish. NC group (the normal control group for treatment with normal water); LAWPH (the group for treatment with β-lactoglobulin Trp peptides at a high dose: 500 μg/ml); LAWPL (the group for treatment with β-lactoglobulin Trp peptides at a low dose: 56 μg/ml); VAGTWYH (the group for treatment with Val-Ala-Gly-Thr-Tyr-Trp at a high dose: 500 μg/ml); VAGTWYL (the group for treatment with Val-Ala-Gly-Thr-Tyr-Trp at a low dose: 56 μg/ml); VAGTWH (the group for treatment with Val-Ala-Gly-Thr-Tyr-Trp at a high dose: 500 μg/ml); VAGTWL (the group for treatment with Val-Ala-Gly-Thr-Tyr-Trp at a low dose: 56 μg/ml); GTWH (the group for treatment with Gly-Thr-Trp at a high dose: 500 μg/ml); GTWL (the group for treatment with Gly-Thr-Trp at a low dose: 56 μg/ml). Data are expressed as the mean ± SD (n = 30), and ANOVA was performed to evaluate the difference, followed by the Duncan post-hoc test. The bar graph and the line graph show the activities of TPH (the left ordinate) and the level of 5-HT (the right ordinate), respectively. Different letters indicate a significant difference (p < 0.05).