
|
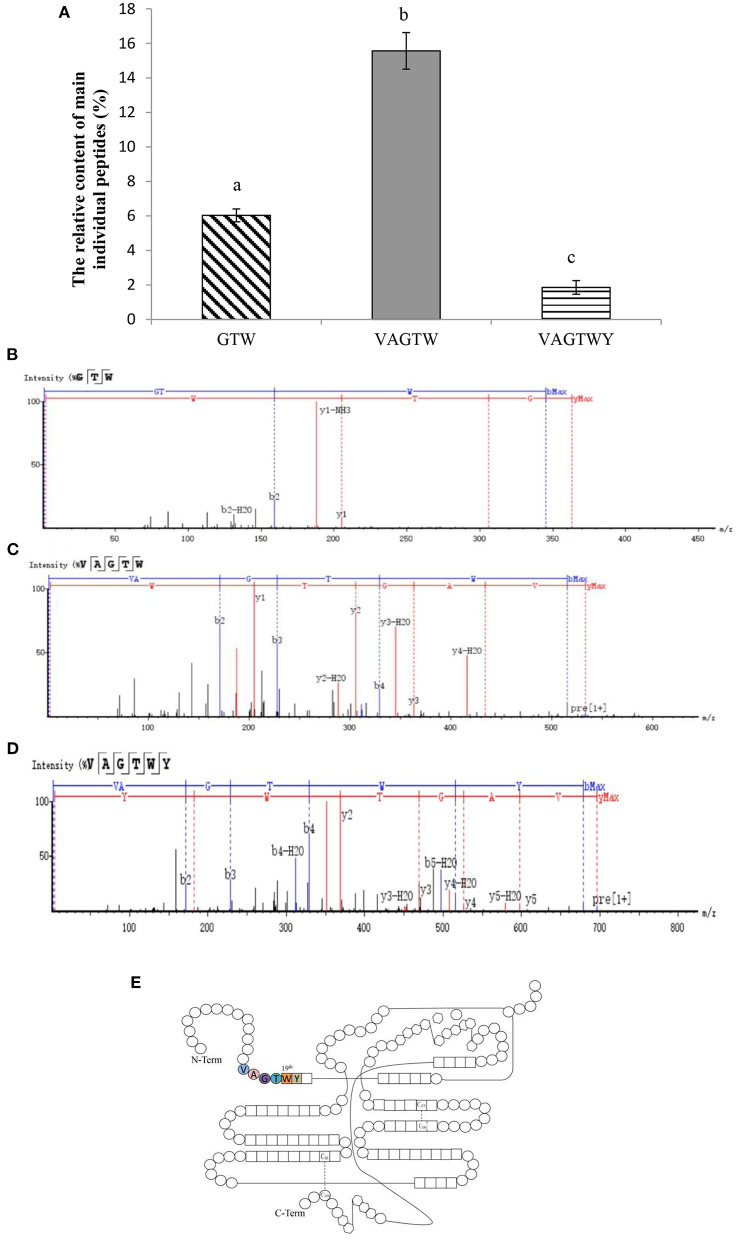
Figure 2
Characterization of Trp peptides obtained from β-lactoglobulin. Data are expressed as the mean ± SD, and ANOVA was performed to evaluate the difference, followed by the Duncan post-hoc test. (A) The relative content of peptides (GTW, VAGTW, and VAGTWT) produced from β-lactoglobulin. Different letters (a, b, and c) indicate a significant difference (p < 0.05). The UPLC-Q-TOF MS/MS tandem mass spectra (ESI+) of (B) GTW (Gly-Thr-Trp), (C) VAGTW (Val-Ala-Gly-Thr-Trp), and (D) VAGTWY (Val-Ala-Gly-Thr-Trp-Tyr) as interpreted by peaks automatic sequencing software. (E) Schematic diagram of the molecular structure of β-lactoglobulin.