
- Title
-
Activation of a transient progenitor state in the epicardium is required for zebrafish heart regeneration
- Authors
- Xia, Y., Duca, S., Perder, B., Dündar, F., Zumbo, P., Qiu, M., Yao, J., Cao, Y., Harrison, M.R.M., Zangi, L., Betel, D., Cao, J.
- Source
- Full text @ Nat. Commun.

a Cartoon of an adult zebrafish heart showing the ventricle and outflow tract (OFT). The frames indicate representative regions for cryosection-section images in b, c and e. b A cryosection image of an uninjured heart showing tcf21:nucEGFP in magenta, antibody staining against aldh1a2 in green. Nuclei were stained with DAPI (blue). A single-channel image of aldh1a2 signals is shown in grayscale on the right. Arrowheads indicate EGFP+adh1a2+ cells. Scale bar, 50 μm. c A cryosection image of an uninjured heart showing tcf21:nucEGFP in magenta, antibody staining against Tnnt in green. Nuclei were stained with DAPI (blue). A single-channel image of EGFP is shown in grayscale on the right. Arrows indicate EGFP+ mesenchymal epicardial cells. Scale bar, 50 μm. d Schematic of experimental design for modRNA injection. e Section images of uninjured (left) and 7 dpa (right) hearts carrying the tcf21:Switch reporter at 10 days post Cre modRNA injection. Arrows and arrowheads indicate representative mCherry+ mesenchymal and epithelial cells, respectively. Scale bar, 50 μm. f Quantification of mCherry+ mesenchymal epicardial cells in the experiment of e. The largest cryosection of each heart was quantified for mCherry+ cells in the apex half of the ventricle. n = 13 (Ctrl) and 6 (7 dpa), respectively. Two-tailed Student’s t test. The box plot shows the median (center line), upper and lower quartiles (box limits), minimum and maximum values (whiskers), and individual values (points). Source data are provided as a Source data file. |
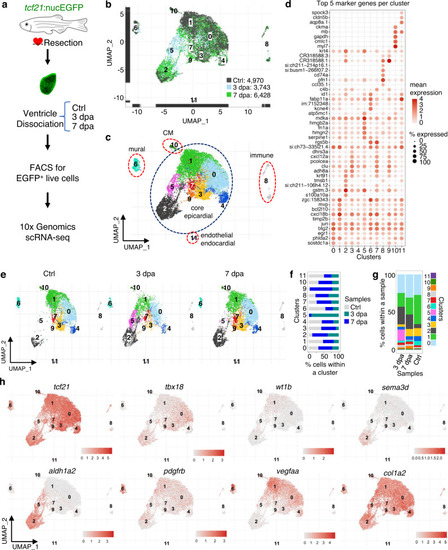
a Experimental design for single epicardial cell isolation and transcriptome sequencing. b UMAP of three samples combined. After the removal of droplets with very few genes as well as genes that could not be detected in at least 5 cells, the final dataset comprised 4970, 3743, and 6428 cells for Ctrl, 3 dpa, and 7 dpa, respectively. c UMAP of cell clusters with inferred cellular identities. d Expression of top 5 cluster marker genes across different clusters. This dot plot depicts the abundance and expression magnitude of individual genes across cells of given clusters. The size of the dot represents the fraction of cells with at least one UMI of the specified gene. e UMAPs showing changes of clusters across samples. f Proportions of the samples per cluster. g Cluster proportions per sample. h Normalized expression of top marker genes on UMAPs (3 samples combined). |
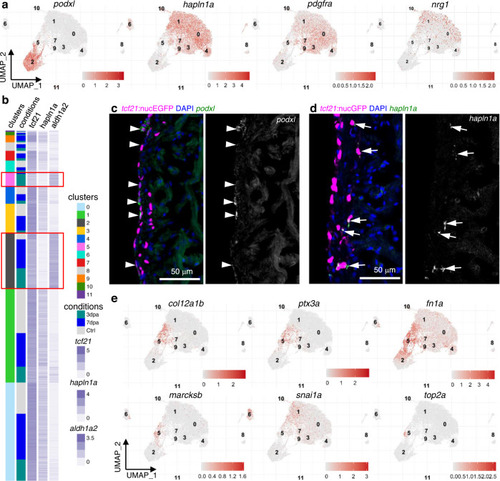
a Normalized expression of marker genes on UMAPs (3 samples combined). b Heatmap of 3 marker genes: tcf21, aldh1a2, and hapln1a. Normalized expression values are shown; cells were sorted by cluster membership. Clusters 2 and 5 are highlighted in red frames. c Images of a 3 dpa heart section showing the ventricular wall with tcf21:nucEGFP in magenta and HCR staining of podxl in green. Nuclei were stained with DAPI (blue). A single-channel image of podxl is shown in grayscale on the right. Arrows indicate representative EGFP+podxl+ cells. Scale bar, 50 μm. d Images of a 3 dpa heart section showing the ventricular wall with tcf21:nucEGFP in magenta and HCR staining of hapln1a in green. Nuclei were stained with DAPI (blue). A single-channel image of hapln1a is shown in grayscale on the right. Arrows indicate representative EGFP+hapln1a+ cells. Scale bar, 50 μm. e Normalized expression levels of marker genes for the 3 dpa-specific cluster on UMAPs (3 samples combined). |
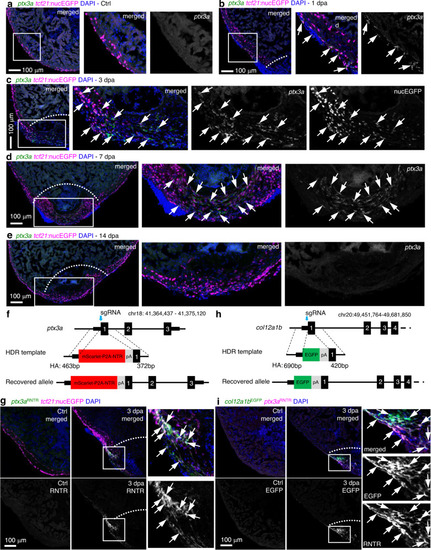
a–e HCR staining results of ptx3a (green) on heart sections collected at 1 (b), 3 (c), 7 (d), and 14 dpa (e) together with the uninjured control (Ctrl, a). tcf21:nucEGFP (magenta) labels the epicardial cells. Nuclei were stained with DAPI (blue). Single-channel images show signals of ptx3a or nucEGFP. White dashed lines indicate the injury sites. The framed regions are enlarged to show details on the right of each panel. Arrows denote representative ptx3a+EGFP+ cells. Scale bars, 100 μm. f Schematic for generating the knock-in alleles for ptx3a. The gRNA binding site is marked with a cyan arrow. g The ptx3aRNTR reporter recapitulates expression of ptx3a in the injured heart (3 dpa). No conclusive epicardial expression was observed in the uninjured heart (Ctrl). tcf21:nucEGFP (magenta) labels the epicardial cells. Nuclei were stained with DAPI (blue). Single-channel images show signals of ptx3aRNTR (with anti-DsRed antibody staining) at the bottom. White dashed lines indicate the injury sites. The framed regions are enlarged to show details on the right. Arrows denote representative RNTR+EGFP+ cells. Images of additional timepoints are in Supplementary Fig. 7. Scale bar, 100 μm. h Schematic for generating the knock-in alleles for col12a1b. The gRNA binding site is marked with a cyan arrow. i Section images showing col12a1bEGFP reporter expression in green and ptx3aRNTR expression in magenta (with anti-DsRed antibody staining). No epicardial EGFP expression was observed in the uninjured heart (left). Nuclei were stained with DAPI (blue). Single-channel images show signals of col12a1bEGFP or ptx3aRNTR. White dashed lines indicate the injury sites. The framed regions are enlarged to show details on the right. Arrows denote representative EGFP+mCherry+ cells. Scale bar, 100 μm. |
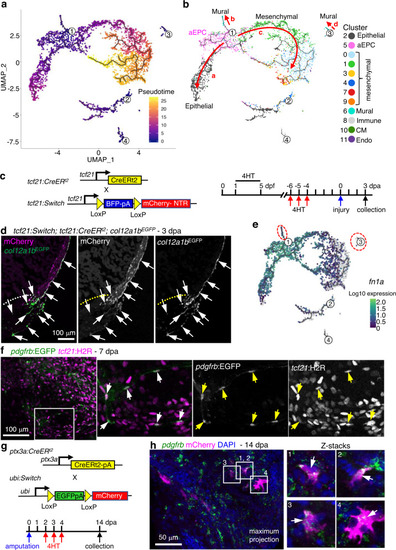
a, b Cell trajectories suggested by pseudotime analysis with Monocle 3. Shown on a UMAP, the starting point of each trajectory was labeled with a number. The pseudotime is shown as a heatmap in a. Red arrows and letters highlight different branches in b. Clusters are labeled in the same number and color as in Fig. 2c. c Schematic of transgenic lines and experimental design to define the origin of aEPCs. 4HT was used at 10 μM. d Section images of 3 dpa hearts carrying the tcf21:Switch; tcf21:CreERt2; col12a1bEGFP reporters. 4HT treatment was performed as indicated in c. mCherry and EGFP are shown in magenta and green, respectively in the merged image. Single-channel images are shown in grayscale. Arrows indicate representative EGFP+mCherry+ cells. White dashed lines indicate the injury sites. Scale bar, 100 μm. e fn1a expression shown on the pseudotime UMAP. The mural cell trajectories are circled with red dashed lines. f Whole-mount images of the ventricular surface showing expression of pdgfrb:EGFP (green) and tcf21:H2R (magenta) in transgenic lines at 7 dpa. The framed regions are enlarged to show details on the right, with single-channel images shown in grayscale. Arrows indicate representative EGFP+mCherry+ cells. Scale bar, 100 μm. g Schematic of transgenic lines and experimental design to define the fate of aEPCs. 4HT was used at 5 μM. h Whole-mount images of the ventricular surface from hearts carrying the ubi:Switch; ptx3a:CreERt2 reporters. pdgfrb expression is detected by HCR staining (green). mCherry is shown in magenta, and nuclei were stained with DAPI (blue). Arrows indicate representative pdgfrb+mCherry+ cells. A maximum projection image is shown on the left. Z-stack images of the numbered frames are shown on the right. Scale bar, 50 μm. |
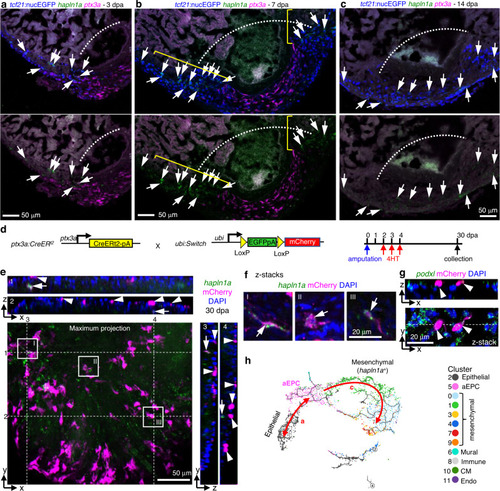
Section images showing HCR staining results of hapln1a (green) and ptx3a (magenta) at 3 (a), 7 (b), and 14 dpa (c). Epicardial cells are labeled with tcf21:nucEGFP (blue). Arrows in a–c indicate representative hapln1a+ cells. The brackets in b outline the regenerated regions that express hapln1a. White dashed lines indicate the injury sites. Scale bars, 50 μm. d Schematic of transgenic lines and experimental design to define the fate of aEPCs. 4HT was used at 5 μM. e Orthogonal view of a z-stack image showing the ventricular surface layers from hearts carrying the ubi:Switch;ptx3a:CreERt2 reporters. A maximum projection image of the x-y plane is shown with hapln1a expression (HCR staining) in green and mCherry in magenta. White dashed lines and numbers indicate positions for views of the y-z planes (right) and the x-z planes (top), respectively. Nuclei were stained with DAPI (blue) and was omitted from the maximum projection image to keep image clarity. Arrows indicate representative hapln1a+mCherry+ cells. Arrowheads indicate mCherry+ cells in the epithelial layer. Scale bar, 50 μm. The framed regions are enlarged to show details in f. f Optical section (z-stack) images of the framed regions in e. Arrows indicate hapln1a+mCherry+ cells. Scale bar, 20 μm. g Orthogonal view of a z-stack image showing the ventricular surface layers from hearts carrying the ubi:Switch;ptx3a:CreERt2 reporters. An optical section image (x-y plane) is shown at the bottom, and the x-z plane of z-stacks in shown on top. mCherry and HCR staining signals of podxl are shown in magenta and green, respectively. The white dashed line indicates position for the view of the x-z plane. Arrowheads indicate podxl+mCherry+ epithelial epicardial cells. h A UMAP highlights pseudotime trajectories a and c. |
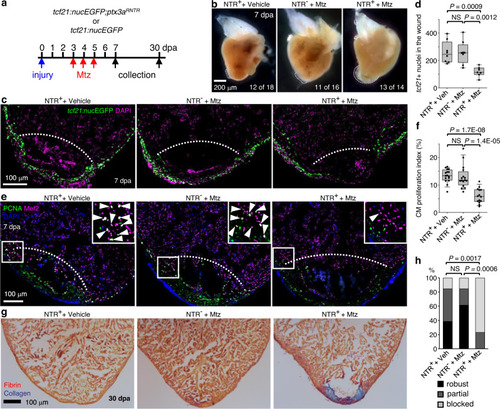
a Experimental design. Siblings carrying the ptx3aRNTR allele and/or the tcf21:nucEGFP reporter were treated with 5 mM Mtz or vehicle (Ctrl) from 3 dpa to 5 dpa. b Whole mount images of hearts collected at 7 dpa. Dash lines denote the injury sites. Large blood clot and extra tissue were observed in hearts of Mtz treated NTR+ animals (13 of 14) but not in those from the vehicle-treated NTR+ fish (12 of 18) or Mtz treated NTR- fish (11 of 16). Scale bar, 200 μm. c Section images of injured ventricles from 3 treatment groups at 7 dpa. The epicardial cells are labeled with tcf21:nucEGFP (green). Nuclei were stained with DAPI (magenta). White dashed lines indicate the injury sites. Scale bar, 100 μm. d Quantification of EGFP+ cells in the wound region from experiments in c. From left to right, n = 8, 8, and 7, respectively. NS not significant. Two-tailed Student’s t test. e Section images of injured ventricles from 3 treatment groups at 7 dpa. Ventricular CM proliferation was assessed by anti-PCNA (green) and Mef2 (magenta) staining. Nuclei were stained with DAPI (blue). The framed regions are enlarged to show proliferating CMs (some denoted with arrowheads). f Quantified PCNA+ CM indices in injury sites in experiments from e. From left to right, n = 16, 16, and 14, respectively. NS, not significant. Two-tailed Student’s t test. g Section images of ventricles at 30 dpa stained with Acid Fuchsin-Orange G to characterize non-muscle components in the injuries (blue for collagen, red for fibrin). h Semiquantitative assessment of cardiac injuries based on muscle and scar morphology (robust, partial, or blocked regeneration). Data were analyzed using Fisher’s exact test. n = 13 for each treatment group. NS not significant. Box plots show the median (center line), upper and lower quartiles (box limits), minimum and maximum values (whiskers), and individual values (points). Source data are provided as a Source data file. |
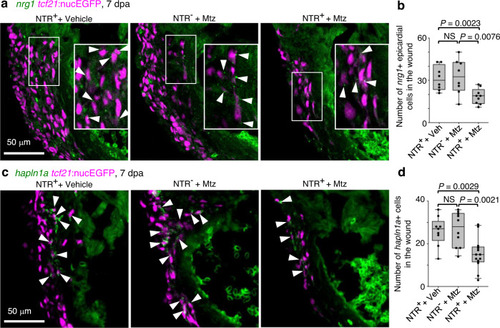
a Section images of the injury site showing HCR staining of nrg1 in green and tcf21:nucEGFP in magenta. The framed regions are enlarged to show details with arrowheads denoting representative nrg1+EGFP+ cells. Scale bar, 50 μm. b Quantification of nrg1+ epicardial cells in the wound regions shown in a. From left to right, n = 8, 8, and 9, respectively. NS, not significant. Two-tailed Student’s t test. c Section images of the injury site showing HCR staining of hapln1a in green and tcf21:nucEGFP in magenta. Arrowheads indicate representative hapln1a+EGFP+ cells. Scale bar, 50 μm. d Quantification of hapln1a+EGFP+ cells in the wound regions shown in c. From left to right, n = 9, 10, and 13, respectively. NS, not significant. Two-tailed Student’s t test. Box plots show the median (center line), upper and lower quartiles (box limits), minimum and maximum values (whiskers), and individual values (points). Source data are provided as a Source data file. |
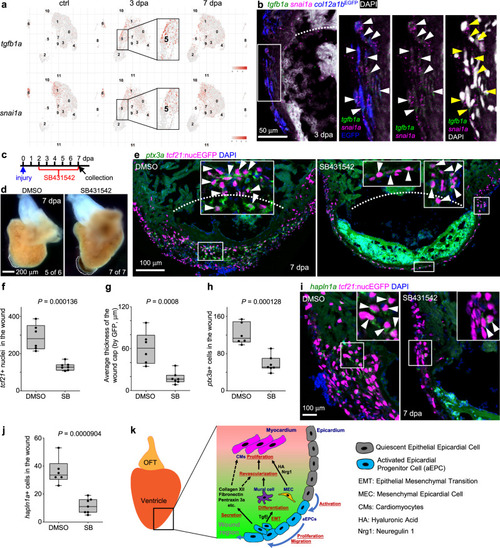
a UMAPs showing tgfb1a and snai1a expression across samples. The aEPC population (cluster 5) is highlighted in frames. b Section images of the injury site showing HCR staining signals of tgfb1a and snai1a at 3 dpa in green and magenta, respectively. col12a1bEGFP is shown in blue. The white dash line denotes the injury site. The framed region is enlarged to show details on the right with different channel combinations. DAPI staining is shown in white in the last panel. Arrowheads indicate representative tgfb1a+snai1a+EGFP+ cells. c Experimental design for SB431542 treatment. d Whole-mount images of hearts collected at 7 dpa. Dash lines denote the injury sites. Large blood clot and extra tissue were observed in SB431542-treated hearts (7 of 7), but not in those from the DMSO-treated fish (5 of 6). Scale bar, 200 μm. e Section images of injured ventricles at 7 dpa. The epicardial cells are labeled with tcf21:nucEGFP (magenta) and HCR staining signals of ptx3a in green. Nuclei were stained with DAPI (blue). White dashed lines indicate the injury sites. The framed regions are enlarged to show details with arrowheads indicating representative ptx3a+EGFP+ cells. Scale bar, 100 μm. Quantifications of tcf21:nucEGFP+ nuclei in the wound region (f), average thickness of the epicardial cap covering the wound (g), and number of ptx3a+ cells (h) from experiments in e. n = 6 (DMSO) and 7 (SB431542), respectively, for each quantification. Two-tailed Student’s t test. i Section images of the injury site showing HCR staining of hapln1a in green and tcf21:nucEGFP in magenta. The framed regions are enlarged to show details with arrowheads indicating representative hapln1a+EGFP+ cells. Scale bar, 100 μm. j Quantification of hapln1a+EGFP+ cells in the wound regions shown in i. n = 6 (DMSO) and 7 (SB431542), respectively. Two-tailed Student’s t test. k The working model. For simplicity, mesenchymal epicardial cells away from the injury site are omitted. The dashed lines indicate predicted mechanisms. Box plots show the median (center line), upper and lower quartiles (box limits), minimum and maximum values (whiskers), and individual values (points). Source data are provided as a Source data file. |