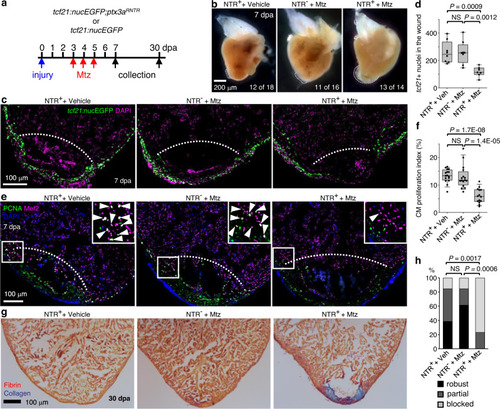
a Experimental design. Siblings carrying the ptx3aRNTR allele and/or the tcf21:nucEGFP reporter were treated with 5 mM Mtz or vehicle (Ctrl) from 3 dpa to 5 dpa. b Whole mount images of hearts collected at 7 dpa. Dash lines denote the injury sites. Large blood clot and extra tissue were observed in hearts of Mtz treated NTR+ animals (13 of 14) but not in those from the vehicle-treated NTR+ fish (12 of 18) or Mtz treated NTR- fish (11 of 16). Scale bar, 200 μm. c Section images of injured ventricles from 3 treatment groups at 7 dpa. The epicardial cells are labeled with tcf21:nucEGFP (green). Nuclei were stained with DAPI (magenta). White dashed lines indicate the injury sites. Scale bar, 100 μm. d Quantification of EGFP+ cells in the wound region from experiments in c. From left to right, n = 8, 8, and 7, respectively. NS not significant. Two-tailed Student’s t test. e Section images of injured ventricles from 3 treatment groups at 7 dpa. Ventricular CM proliferation was assessed by anti-PCNA (green) and Mef2 (magenta) staining. Nuclei were stained with DAPI (blue). The framed regions are enlarged to show proliferating CMs (some denoted with arrowheads). f Quantified PCNA+ CM indices in injury sites in experiments from e. From left to right, n = 16, 16, and 14, respectively. NS, not significant. Two-tailed Student’s t test. g Section images of ventricles at 30 dpa stained with Acid Fuchsin-Orange G to characterize non-muscle components in the injuries (blue for collagen, red for fibrin). h Semiquantitative assessment of cardiac injuries based on muscle and scar morphology (robust, partial, or blocked regeneration). Data were analyzed using Fisher’s exact test. n = 13 for each treatment group. NS not significant. Box plots show the median (center line), upper and lower quartiles (box limits), minimum and maximum values (whiskers), and individual values (points). Source data are provided as a Source data file.
|
