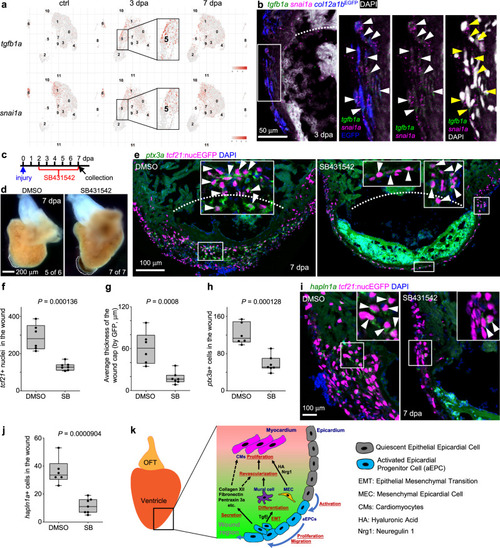
a UMAPs showing tgfb1a and snai1a expression across samples. The aEPC population (cluster 5) is highlighted in frames. b Section images of the injury site showing HCR staining signals of tgfb1a and snai1a at 3 dpa in green and magenta, respectively. col12a1bEGFP is shown in blue. The white dash line denotes the injury site. The framed region is enlarged to show details on the right with different channel combinations. DAPI staining is shown in white in the last panel. Arrowheads indicate representative tgfb1a+snai1a+EGFP+ cells. c Experimental design for SB431542 treatment. d Whole-mount images of hearts collected at 7 dpa. Dash lines denote the injury sites. Large blood clot and extra tissue were observed in SB431542-treated hearts (7 of 7), but not in those from the DMSO-treated fish (5 of 6). Scale bar, 200 μm. e Section images of injured ventricles at 7 dpa. The epicardial cells are labeled with tcf21:nucEGFP (magenta) and HCR staining signals of ptx3a in green. Nuclei were stained with DAPI (blue). White dashed lines indicate the injury sites. The framed regions are enlarged to show details with arrowheads indicating representative ptx3a+EGFP+ cells. Scale bar, 100 μm. Quantifications of tcf21:nucEGFP+ nuclei in the wound region (f), average thickness of the epicardial cap covering the wound (g), and number of ptx3a+ cells (h) from experiments in e. n = 6 (DMSO) and 7 (SB431542), respectively, for each quantification. Two-tailed Student’s t test. i Section images of the injury site showing HCR staining of hapln1a in green and tcf21:nucEGFP in magenta. The framed regions are enlarged to show details with arrowheads indicating representative hapln1a+EGFP+ cells. Scale bar, 100 μm. j Quantification of hapln1a+EGFP+ cells in the wound regions shown in i. n = 6 (DMSO) and 7 (SB431542), respectively. Two-tailed Student’s t test. k The working model. For simplicity, mesenchymal epicardial cells away from the injury site are omitted. The dashed lines indicate predicted mechanisms. Box plots show the median (center line), upper and lower quartiles (box limits), minimum and maximum values (whiskers), and individual values (points). Source data are provided as a Source data file.
|
