
- Title
-
Assessment of unique behavioral, morphological, and molecular alterations in the comparative developmental toxicity profiles of PFOA, PFHxA, and PFBA using the zebrafish model system
- Authors
- Wasel, O., Thompson, K.M., Freeman, J.L.
- Source
- Full text @ Environ. Int.
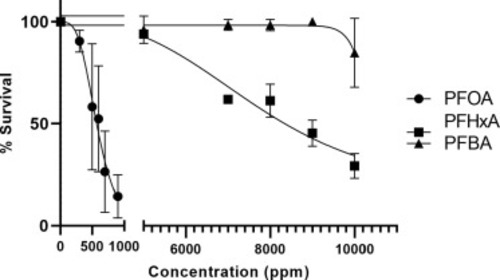
120 hpf-LC50 curves of developing zebrafish exposed to PFOA, PFHxA or PFBA from 1 to 120 hpf. The overall toxicity ranking is PFOA > PFHxA > PFBA. The LC50 for PFOA = 561.01 ppm, for PFHxA = 8394.5 ppm, and for PFBA > 10,000 ppm. N = 3 with 50 fish per treatment per replicate. Error bars are standard deviation. |
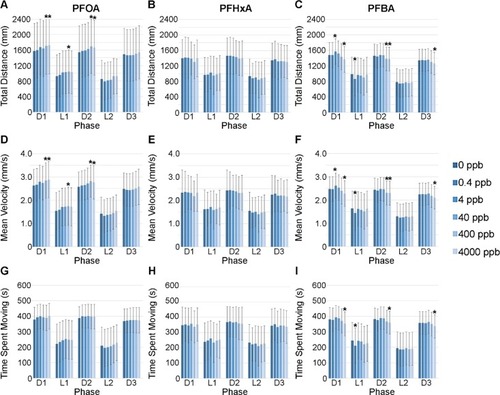
Visual motor response behavior assay in zebrafish larvae at 120 hpf following an embryonic exposure (1–72 hpf) to PFOA (A, D, G), PFHxA (B, E, H), or PFBA (C, F, I). N = 8 biological replicates with 13–16 subsamples per treatment per replicate to total 122–128 fish per treatment group. Error bars represent standard deviation. *p < 0.05 compared to the control treatment group within each phase based on lsmeans table when a significant ANOVA for treatment or interaction occurred. (D1: first dark phase; L1: first light phase; D2: second dark phase; L2: second light phase; D3: third dark phase). |
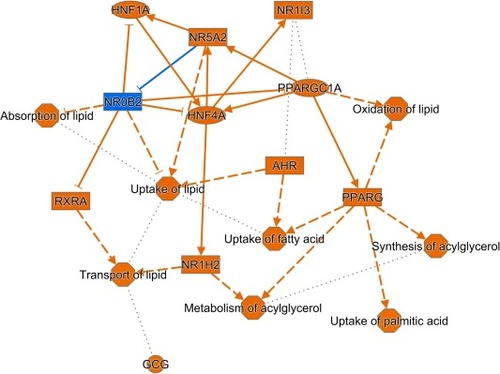
Top altered regulators and functions in zebrafish exposed to 400 ppb PFBA during embryogenesis. The top regulators and functions are primarily associated with lipid pathways. Rectangles represent ligand-dependent nuclear receptor, hexagons represent function, ovals represent transcription regulator, and circles represent other molecules. Blue indicates predicted inhibition and orange indicates predicted activation. Lines with arrows indicate activation and lines without arrows indicate inhibition. A solid line indicates direct interaction and a dashed line indicates indirect interaction. A dotted line indicates that the association is predicated but not confirmed in literature. |
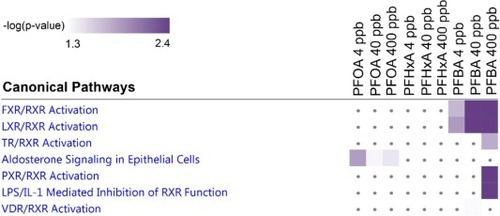
Comparison analysis showing canonical pathways related to nuclear receptor signaling following embryonic exposure to PFOA, PFHxA, or PFBA. Purple color indicates statistical significance (-log (p-value) = 1.3). Intensity of color correspond to – log (p-value). |
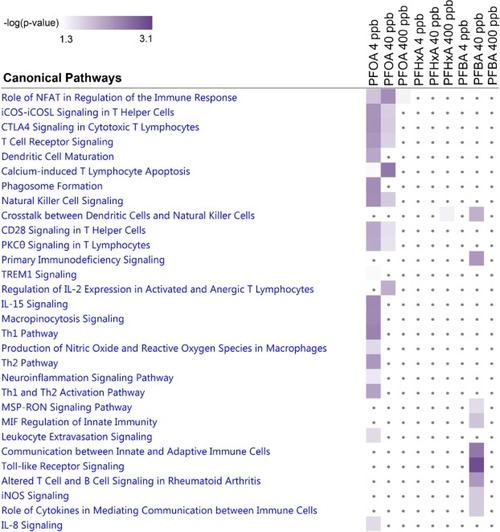
Comparison analysis showing canonical pathways related to cellular immune response following embryonic exposure to PFOA, PFHxA, or PFBA. Purple color indicates statistical significance (-log (p-value) = 1.3). Intensity of color correspond to – log (p-value). |