
Image
|
Figure Caption
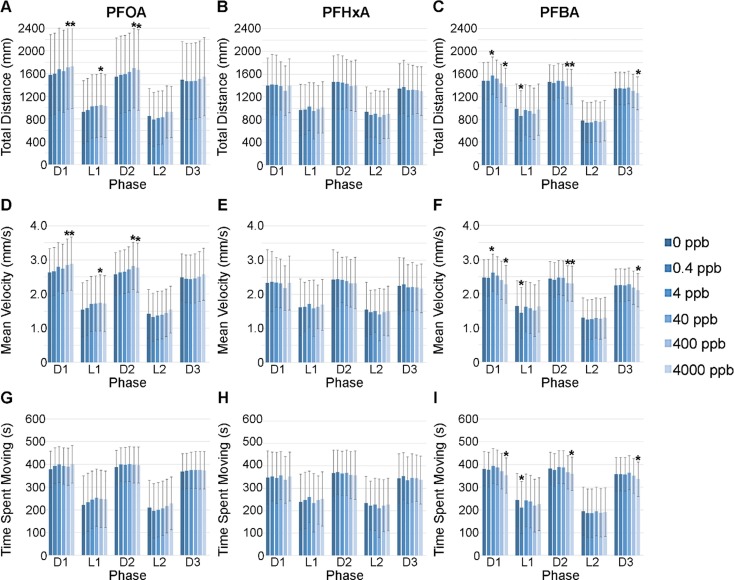
Fig. 2 Visual motor response behavior assay in zebrafish larvae at 120 hpf following an embryonic exposure (1–72 hpf) to PFOA (A, D, G), PFHxA (B, E, H), or PFBA (C, F, I). N = 8 biological replicates with 13–16 subsamples per treatment per replicate to total 122–128 fish per treatment group. Error bars represent standard deviation. *p < 0.05 compared to the control treatment group within each phase based on lsmeans table when a significant ANOVA for treatment or interaction occurred. (D1: first dark phase; L1: first light phase; D2: second dark phase; L2: second light phase; D3: third dark phase).
Acknowledgments
This image is the copyrighted work of the attributed author or publisher, and
ZFIN has permission only to display this image to its users.
Additional permissions should be obtained from the applicable author or publisher of the image.
Full text @ Environ. Int.