
Image
|
Figure Caption
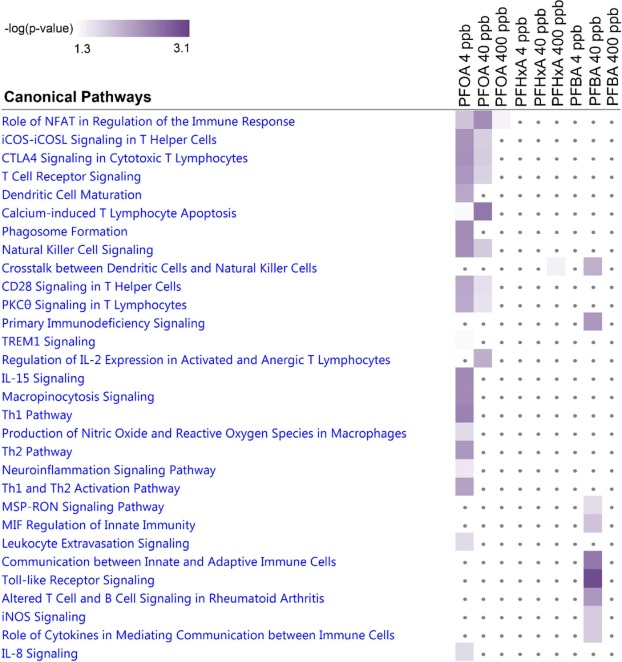
Fig. 5 Comparison analysis showing canonical pathways related to cellular immune response following embryonic exposure to PFOA, PFHxA, or PFBA. Purple color indicates statistical significance (-log (p-value) = 1.3). Intensity of color correspond to – log (p-value).
Acknowledgments
This image is the copyrighted work of the attributed author or publisher, and
ZFIN has permission only to display this image to its users.
Additional permissions should be obtained from the applicable author or publisher of the image.
Full text @ Environ. Int.