
FIGURE
Fig. 1
- ID
- ZDB-FIG-230510-14
- Publication
- Wasel et al., 2022 - Assessment of unique behavioral, morphological, and molecular alterations in the comparative developmental toxicity profiles of PFOA, PFHxA, and PFBA using the zebrafish model system
- Other Figures
- All Figure Page
- Back to All Figure Page
Fig. 1
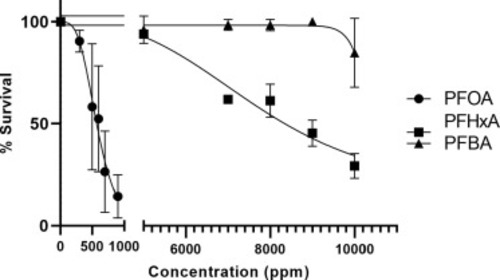
120 hpf-LC50 curves of developing zebrafish exposed to PFOA, PFHxA or PFBA from 1 to 120 hpf. The overall toxicity ranking is PFOA > PFHxA > PFBA. The LC50 for PFOA = 561.01 ppm, for PFHxA = 8394.5 ppm, and for PFBA > 10,000 ppm. N = 3 with 50 fish per treatment per replicate. Error bars are standard deviation. |
Expression Data
Expression Detail
Antibody Labeling
Phenotype Data
Phenotype Detail
Acknowledgments
This image is the copyrighted work of the attributed author or publisher, and
ZFIN has permission only to display this image to its users.
Additional permissions should be obtained from the applicable author or publisher of the image.
Full text @ Environ. Int.