
- Title
-
Developmental defects and behavioral changes in a diet-induced inflammation model of zebrafish
- Authors
- Rehman, S., Gora, A.H., Varshney, S., Dias, J., Olsvik, P.A., Fernandes, J.M.O., Brugman, S., Kiron, V.
- Source
- Full text @ Front Immunol
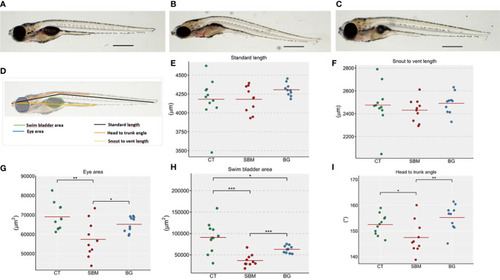
Diet-induced morphological changes in zebrafish larvae. Representative images of the zebrafish larvae fed the |
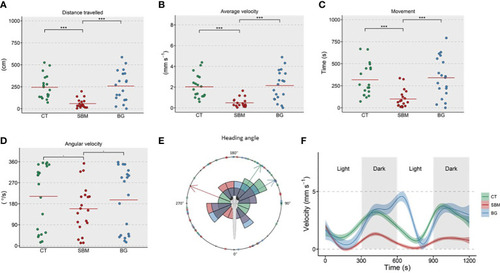
Changes in parameters linked to locomotor activity of zebrafish larvae. The measured parameters included |
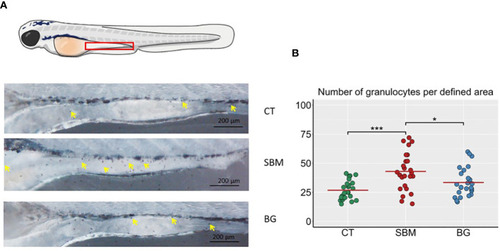
Localization of granulocytes in the intestine of zebrafish larvae. |
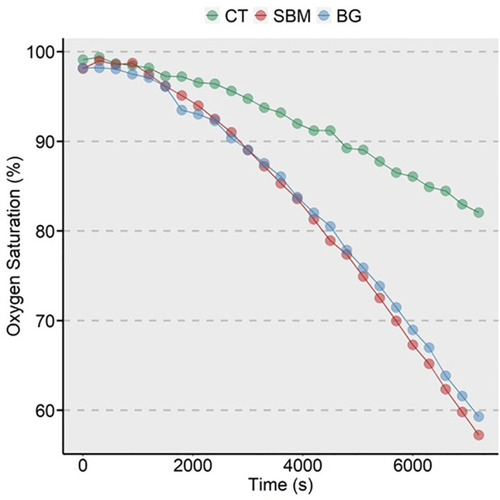
Oxygen consumption of zebrafish larvae from the 3 study groups. A generalized additive model using R package |
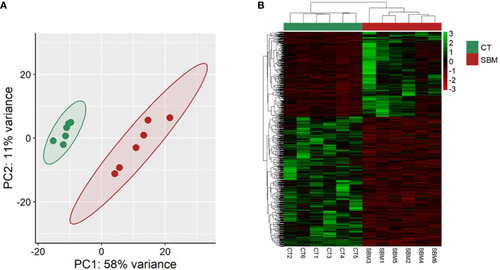
Transcriptome-based differences in zebrafish larvae from the soybean group compared to the control group. Principal component analyses |
Network plot showing the link between the enriched GO terms. DEGs (downregulated; SBM vs CT) that were considered for the enrichment are indicated using red circles and only the non-redundant GO terms are shown in the cluster. The gradient color bar intensity varies with the |
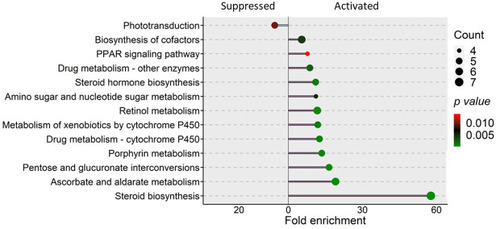
KEGG pathways that were enriched in the zebrafish larvae from the soybean group. Differentially expressed genes in the soybean (SBM) group compared to the control (CT) group were employed for the pathway enrichment analysis. The size of the circles is proportional to the gene count and gradient color bar intensity of circle correlates with the |
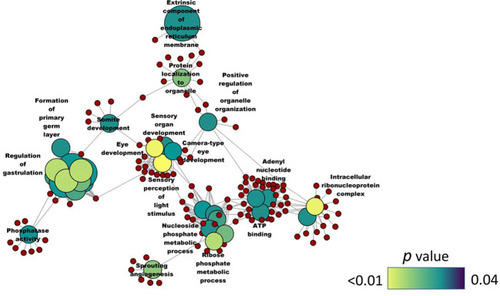
Network plot showing the link between enriched GO terms. DEGs (upregulated; SBM vs CT) that were considered for the enrichment are indicated using red circles and only the non-redundant GO terms are shown in the cluster. The gradient color bar intensity varies with the |
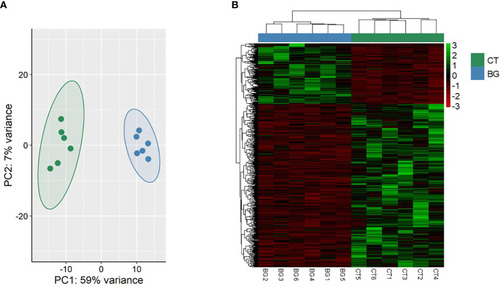
Transcriptome-based differences in the zebrafish larvae from the β-glucan group compared to the control group. Principal component analyses |
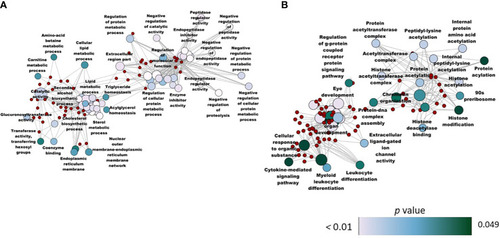
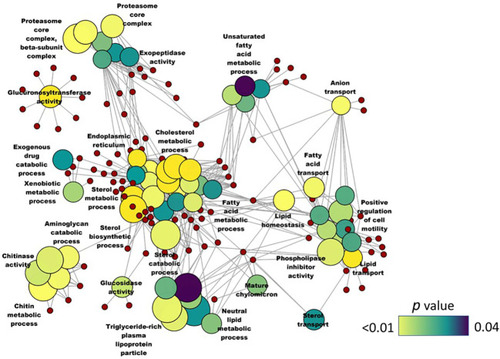
Network plot showing the link between the enriched GO terms. The enriched GO terms that were unique (from the BG and SBM vs CT comparisons) to the zebrafish larvae fed with the BG diet are shown in the figure, and 298 and 95 genes were significantly |