
FIGURE
Figure 7
Figure 7
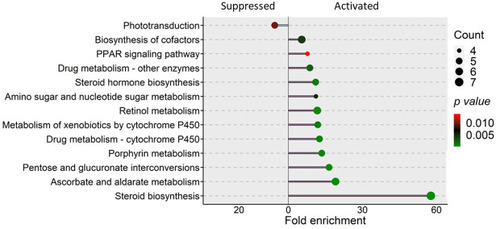
KEGG pathways that were enriched in the zebrafish larvae from the soybean group. Differentially expressed genes in the soybean (SBM) group compared to the control (CT) group were employed for the pathway enrichment analysis. The size of the circles is proportional to the gene count and gradient color bar intensity of circle correlates with the |
Expression Data
Expression Detail
Antibody Labeling
Phenotype Data
Phenotype Detail
Acknowledgments
This image is the copyrighted work of the attributed author or publisher, and
ZFIN has permission only to display this image to its users.
Additional permissions should be obtained from the applicable author or publisher of the image.
Full text @ Front Immunol