
- Title
-
Osteoclast activity sculpts craniofacial form to permit sensorineural patterning in the zebrafish skull
- Authors
- Miao, K.Z., Cozzone, A., Caetano-Lopes, J., Harris, M.P., Fisher, S.
- Source
- Full text @ Front Endocrinol (Lausanne)
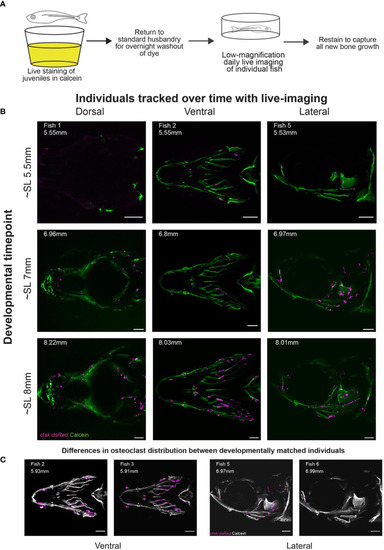
Daily live imaging shows changes in osteoclast distribution. Osteoclasts in six individuals were tracked throughout initiation and early growth of bone in the skull, all scale bars represent 200μm. (A) Diagram representing the workflow for daily live imaging of the transgenic ctsk:dsRed fish, fish were individually housed and then stained with calcein to capture bone growth, then returned to husbandry system to allow for both washout of dye and regular feedings between each daily live imaging session. (B) Osteoclast location and distribution is shown on calcein stained mineralized bone. Differences can be tracked within individuals over time and imaging capturing the dorsal, ventral and lateral angles allows for the tracking of osteoclasts on the entirety of the skull (C) Representative osteoclast distributions in magenta are displayed on a greyscale image of calcein staining showing that when comparing between individuals, though matched by developmental timepoint (as shown in SL), there is variation in distribution. |
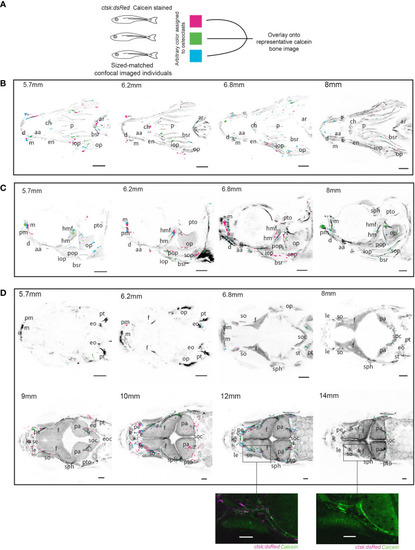
Overlays of osteoclasts from imaged individuals shows patterns in distribution. Three individuals were size-matched, stained and live-imaged to create each representation, all scale bars represent 200μm. (A) Diagram representing the methodology used to combine the three individuals in each image. (B) Ventral imaging shows that osteoclasts are distributed along the branchiostegal rays (bsr) throughout all of the tracked developmental timepoints, in addition concentrations of osteoclast can be seen on the mandibles (m) which house lateral line neuromasts (C) Lateral imaging of osteoclasts shows the same distributions as seen on the branchiostegal rays and mandibles but 6.8mm and 8mm images show concentrations of osteoclasts specifically around the hyomandibular foramina (hmf) and on the opercle (op) (D) Dorsal imaging of osteoclasts shows that osteoclasts are not highly active prior to growth of the frontal (f) and parietal bones (pa), with a notable concentration of osteoclasts around the supraorbital lateral line canals which run through the frontal bones around 10mm and 12mm which is comparatively reduced by 14mm, a detailed comparison of individuals at 12mm and 14mm is shown in unprocessed form. Abbreviations: aa (anguloarticular), ar (arches), bsr (branchiostegal ray), ch (ceratohyal), d (dentary), en (entopterygoid), eo (epioccipital), e (ethmoid), eoc (exoccipital), ff (facial nerve foramen), f (frontal), hm (hyomandibula), iop (interopercle), k (kinethmoid), le (lateral ethmoid), m (maxilla), op (opercle), p (parasphenoid), pa (parietal), pe (preethmoid), pm (premaxilla), pop (preopercle), pt (posttemporal), pto (pterotic), sph (sphenotic), se (supraethmoid), soc (supraocciptal), so (supraocciptal), so (supraorbital), sop (subopercle), st (supratemporal). |
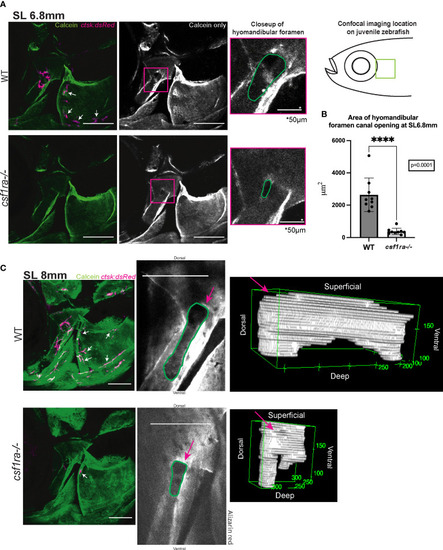
Imaging of hyomandibular foramen using calcein-stained csf1ra mutants with ctsk:dsRed and their wild-type siblings shows differences in canal opening morphology. Size matched individuals were imaged at SL6.8mm and SL8mm, all images are max projections of collected z-stacks, scale bars represent 200μm unless otherwise indicated. (A) Diagram represents location of the confocal imaging conducted on the lateral side of the fish focusing in on area of high osteoclast activity as seen in Figure 2. Lack of osteoclast activity in the foramen as seen in csf1ra mutants results in morphological differences in the foramen canal opening (B) Quantification of area of canal opening (WT n=9, csf1ra-/- n=9) lines indicate mean with SEM, Mann-Whitney U t-test (two-tailed) used for statistical analysis, 95% confidence interval **** indicates p-value = 0.0001 (C) Individuals at SL8mm display differences in canal morphology shown using representative 3D renderings of internal volume inside of the canals of WT siblings and csf1ra mutants, videos of these 3D renderings can be found in the Supplemental Figures. |
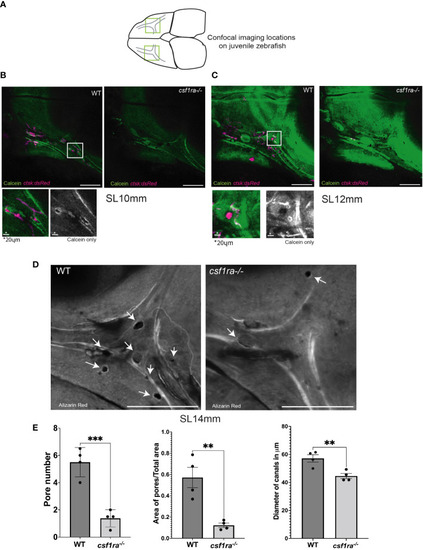
Imaging of supraorbital lateral line canals using calcein-stained csf1ra mutants with ctsk:dsRed and their wild-type siblings shows spatial associations between osteoclasts and foramina in the supraorbital lateral line canals. Individuals were size matched prior to imaging; all images are max projections of z-stacks and scale bars are 200μm unless otherwise indicated. (A) Highlighted areas on scheme represent locations of the confocal imaging conducted on the dorsal side of the skull in an area of high osteoclast activity as previously described in Figure 2 (B) SL10mm calcein-stained ctsk:dsRed csf1ra-/- mutants were live-imaged and wild type siblings show differences in osteoclast expression related to bone morphology. (C) SL12mm calcein-stained ctsk:dsRed live-imaged WT siblings and csf1ra-/- mutants show a continuing pattern from the earlier 10mm stage with activity around the pores (D) Bone from fixed alizarin red stained SL14mm individuals was imaged to capture a 3D representation, showing canals which lack pores in the mutant fish. (E) Quantification (WT n=4, csf1ra-/- n=4) of the number of pores (p=0.0006), followed by the area of the pores normalized using the total area (p=0.03). Measurements were taken from the canals on each frontal bone from the same individual. Since we cannot assume that the paired structures from each fish are independent these numbers were then averaged to generate one figure per individual prior to comparative analysis. Finally diameter of the canals at the juncture point was compared (p=0.008) with location of measurements taken marked in (C), this generated 47 total measurements, 24 for the WT and 23 for the mutants (with one measurement missing due to irregularity of shape in mutant canal) the measurements from a single individual were averaged then statistical analysis conducted. For all charts lines indicate mean with SEM, Mann-Whitney U t-test (two-tailed) used for statistical analysis, 95% confidence interval. ** indicates p-value < 0.005, *** indicates p-value < 0.0005. |