
Figure 1
- ID
- ZDB-FIG-221118-2
- Publication
- Miao et al., 2022 - Osteoclast activity sculpts craniofacial form to permit sensorineural patterning in the zebrafish skull
- Other Figures
- All Figure Page
- Back to All Figure Page
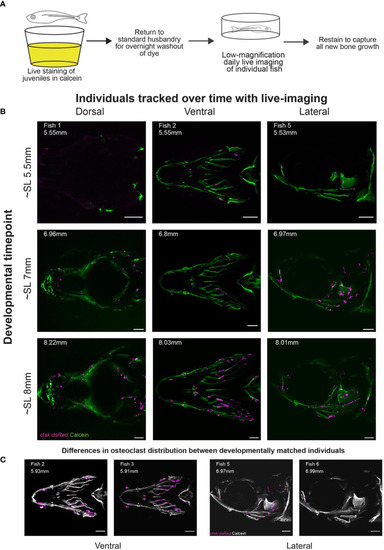
Daily live imaging shows changes in osteoclast distribution. Osteoclasts in six individuals were tracked throughout initiation and early growth of bone in the skull, all scale bars represent 200μm. (A) Diagram representing the workflow for daily live imaging of the transgenic ctsk:dsRed fish, fish were individually housed and then stained with calcein to capture bone growth, then returned to husbandry system to allow for both washout of dye and regular feedings between each daily live imaging session. (B) Osteoclast location and distribution is shown on calcein stained mineralized bone. Differences can be tracked within individuals over time and imaging capturing the dorsal, ventral and lateral angles allows for the tracking of osteoclasts on the entirety of the skull (C) Representative osteoclast distributions in magenta are displayed on a greyscale image of calcein staining showing that when comparing between individuals, though matched by developmental timepoint (as shown in SL), there is variation in distribution. |