
|
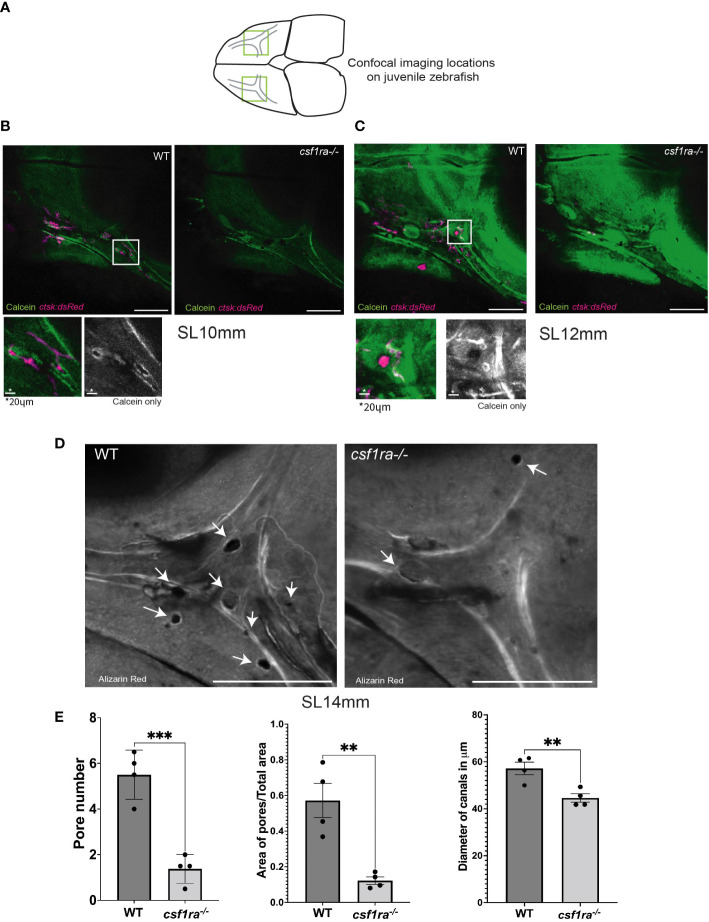
Figure 4 Imaging of supraorbital lateral line canals using calcein-stained csf1ra mutants with ctsk:dsRed and their wild-type siblings shows spatial associations between osteoclasts and foramina in the supraorbital lateral line canals. Individuals were size matched prior to imaging; all images are max projections of z-stacks and scale bars are 200μm unless otherwise indicated. (A) Highlighted areas on scheme represent locations of the confocal imaging conducted on the dorsal side of the skull in an area of high osteoclast activity as previously described in Figure 2 (B) SL10mm calcein-stained ctsk:dsRed csf1ra-/- mutants were live-imaged and wild type siblings show differences in osteoclast expression related to bone morphology. (C) SL12mm calcein-stained ctsk:dsRed live-imaged WT siblings and csf1ra-/- mutants show a continuing pattern from the earlier 10mm stage with activity around the pores (D) Bone from fixed alizarin red stained SL14mm individuals was imaged to capture a 3D representation, showing canals which lack pores in the mutant fish. (E) Quantification (WT n=4, csf1ra-/- n=4) of the number of pores (p=0.0006), followed by the area of the pores normalized using the total area (p=0.03). Measurements were taken from the canals on each frontal bone from the same individual. Since we cannot assume that the paired structures from each fish are independent these numbers were then averaged to generate one figure per individual prior to comparative analysis. Finally diameter of the canals at the juncture point was compared (p=0.008) with location of measurements taken marked in (C), this generated 47 total measurements, 24 for the WT and 23 for the mutants (with one measurement missing due to irregularity of shape in mutant canal) the measurements from a single individual were averaged then statistical analysis conducted. For all charts lines indicate mean with SEM, Mann-Whitney U t-test (two-tailed) used for statistical analysis, 95% confidence interval. ** indicates p-value < 0.005, *** indicates p-value < 0.0005.