
|
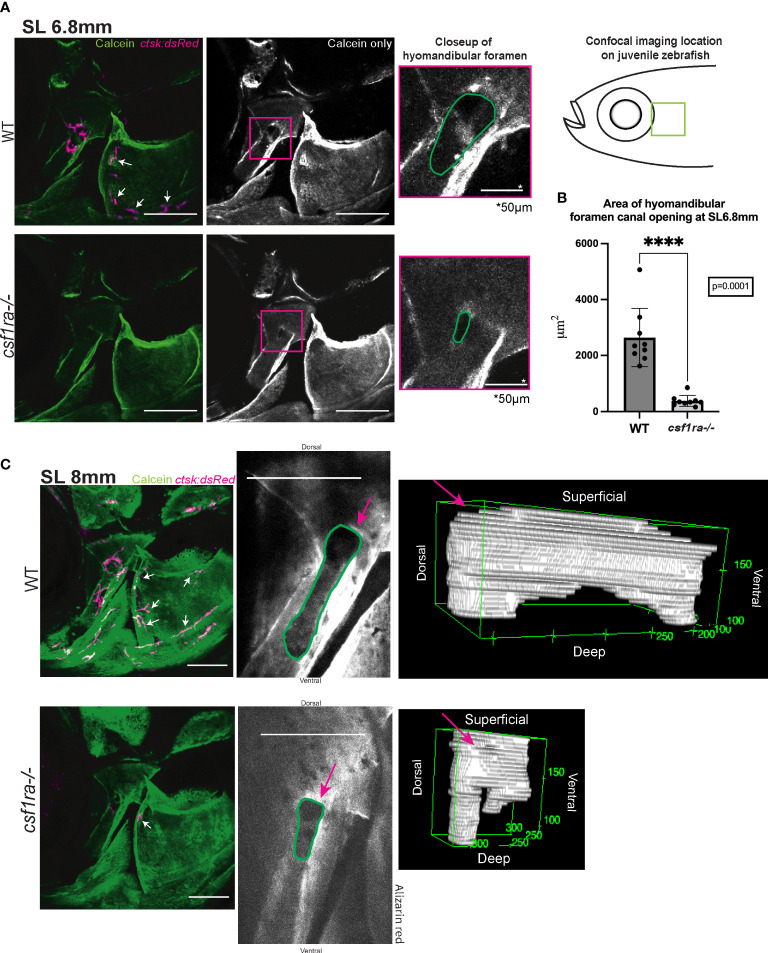
Figure 3 Imaging of hyomandibular foramen using calcein-stained csf1ra mutants with ctsk:dsRed and their wild-type siblings shows differences in canal opening morphology. Size matched individuals were imaged at SL6.8mm and SL8mm, all images are max projections of collected z-stacks, scale bars represent 200μm unless otherwise indicated. (A) Diagram represents location of the confocal imaging conducted on the lateral side of the fish focusing in on area of high osteoclast activity as seen in Figure 2. Lack of osteoclast activity in the foramen as seen in csf1ra mutants results in morphological differences in the foramen canal opening (B) Quantification of area of canal opening (WT n=9, csf1ra-/- n=9) lines indicate mean with SEM, Mann-Whitney U t-test (two-tailed) used for statistical analysis, 95% confidence interval **** indicates p-value = 0.0001 (C) Individuals at SL8mm display differences in canal morphology shown using representative 3D renderings of internal volume inside of the canals of WT siblings and csf1ra mutants, videos of these 3D renderings can be found in the Supplemental Figures.