
- Title
-
Neurotoxicity of diesel exhaust extracts in zebrafish and its implications for neurodegenerative disease
- Authors
- Ha, S.M., Barnhill, L.M., Li, S., Bronstein, J.M.
- Source
- Full text @ Sci. Rep.
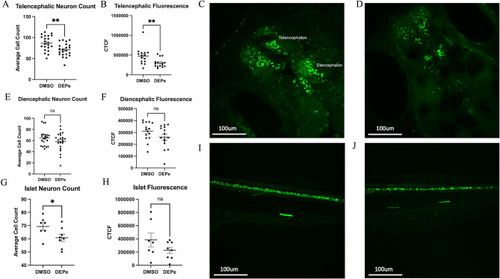
DEPe-induced neurotoxicity. Significant loss of telencephalic neurons and GFP fluorescence with DEPe exposure (A,B). Dorsal view of 5dpf DMSO- (C) and DEPe-treated (D) vmat2:GFP ZF brains. No significant change in diencephalic neuron numbers (E) or fluorescence (F) with DEPe exposure. **p < 0.01, n = 22, 15 (DMSO, DEPe). Significant loss of islet neurons with DEPe exposure (G) but no significant loss of islet fluorescence (H) with DEPe exposure. Lateral view of 5dpf DMSO-treated (I) and DEPe-treated (J) Tg(isl1[ss]:Gal4-VP16,UAS:eGFP)zf154 tail. *p < 0.05, n = 7, 8 (DMSO, DEPe). Student’s T-test; error bars represent SEM. |
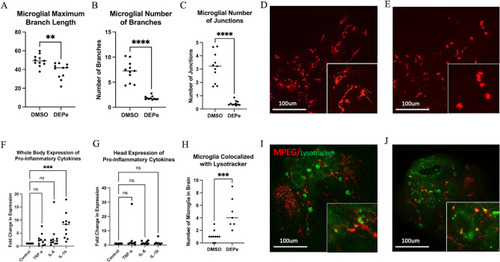
Microglial activation with DEPe exposure. Maximum branch length was significantly shorter (A), fewer numbers of branches (B) and fewer junctions (C) with DEPe exposure. Student’s T-test, **p < 0.01, ****p < 0.0001, n = 11, 11 (DMSO, DEPe). Dorsal view of 5dpf mpeg1:mCherry ZF brains revealing that control microglia (D) had more processes and were less rounded than DEPe-treated cells (E). Whole-body expression of pro-inflammatory cytokines with DEPe exposure, IL-1b expression was significantly upregulated compared to DMSO (F). There were no significant changes in expression of pro-inflammatory cytokines with DEPe exposure in the heads of ZF (G). For F and G, one-way ANOVA with Dunnett’s test, ***p < 0.001, n = 5 samples. Significantly more microglial cells colocalized with lysotracker-labeling 5dpf in DEPe-treated microglia (H,J) compared to DMSO-treated controls (H,I). Student’s T-test, ***p < 0.001, n = 10, 7. |
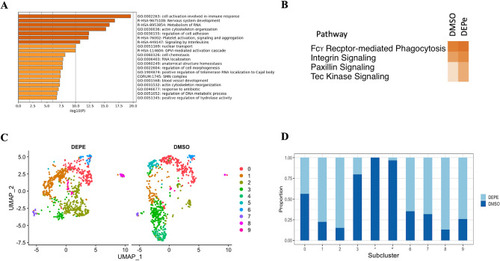
Microglial cluster analysis with and without DEPe exposure. (A) The top enriched biological processes for control microglia. (B) Ingenuity Pathways Analysis summary. Darker orange denotes more activated pathways (z-score > 2 and p-value < 0.05). (C) UMAP plots of DEPe and DMSO treated microglia subclusters. (D) Subclustered microglia distribution with DEPe and DMSO treatments. |
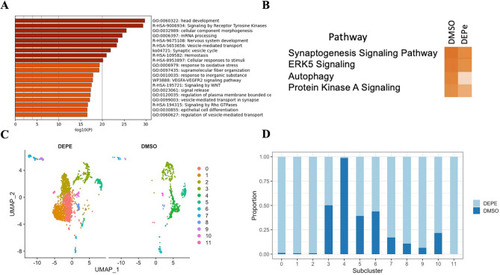
Neuronal cluster 2 analysis with and without DEPe exposure. (A) The top enriched biological processes in control neurons. (B) Ingenuity Pathways Analysis (IPA) summary. Darker orange denotes more activated pathways (z-score > 2; p-value < 0.05). (C) UMAP plots of DEPe and DMSO treated neuronal subclusters. (D) Subclustered neuronal distribution with DEPe and DMSO treatments. |