
FIGURE
Figure 3
- ID
- ZDB-FIG-221118-16
- Publication
- Ha et al., 2022 - Neurotoxicity of diesel exhaust extracts in zebrafish and its implications for neurodegenerative disease
- Other Figures
- All Figure Page
- Back to All Figure Page
Figure 3
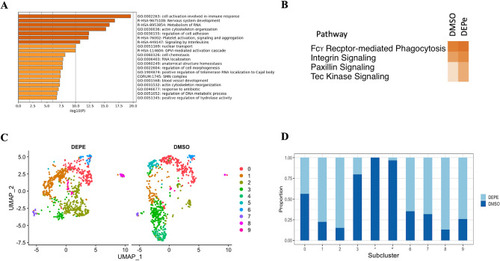
Microglial cluster analysis with and without DEPe exposure. (A) The top enriched biological processes for control microglia. (B) Ingenuity Pathways Analysis summary. Darker orange denotes more activated pathways (z-score > 2 and p-value < 0.05). (C) UMAP plots of DEPe and DMSO treated microglia subclusters. (D) Subclustered microglia distribution with DEPe and DMSO treatments. |
Expression Data
Expression Detail
Antibody Labeling
Phenotype Data
Phenotype Detail
Acknowledgments
This image is the copyrighted work of the attributed author or publisher, and
ZFIN has permission only to display this image to its users.
Additional permissions should be obtained from the applicable author or publisher of the image.
Full text @ Sci. Rep.