
|
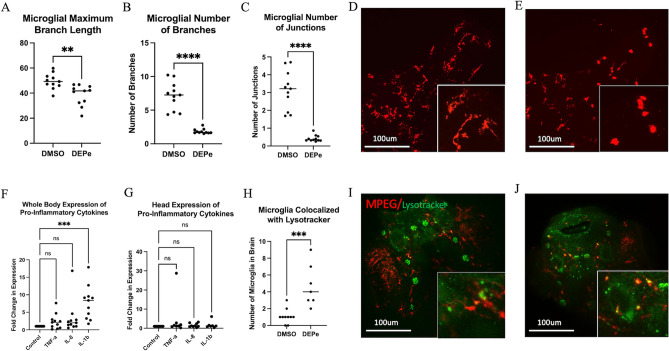
Figure 2 Microglial activation with DEPe exposure. Maximum branch length was significantly shorter (A), fewer numbers of branches (B) and fewer junctions (C) with DEPe exposure. Student’s T-test, **p < 0.01, ****p < 0.0001, n = 11, 11 (DMSO, DEPe). Dorsal view of 5dpf mpeg1:mCherry ZF brains revealing that control microglia (D) had more processes and were less rounded than DEPe-treated cells (E). Whole-body expression of pro-inflammatory cytokines with DEPe exposure, IL-1b expression was significantly upregulated compared to DMSO (F). There were no significant changes in expression of pro-inflammatory cytokines with DEPe exposure in the heads of ZF (G). For F and G, one-way ANOVA with Dunnett’s test, ***p < 0.001, n = 5 samples. Significantly more microglial cells colocalized with lysotracker-labeling 5dpf in DEPe-treated microglia (H,J) compared to DMSO-treated controls (H,I). Student’s T-test, ***p < 0.001, n = 10, 7.