
- Title
-
Zebrafish Galectin 3 binding protein (Lgals3bp) is the target antigen of the microglial 4C4 monoclonal antibody
- Authors
- Rovira, M., Miserocchi, M., Montanari, A., Hammou, L., Chomette, L., Pozo, J., Imbault, V., Bisteau, X., Wittamer, V.
- Source
- Full text @ Dev. Dyn.
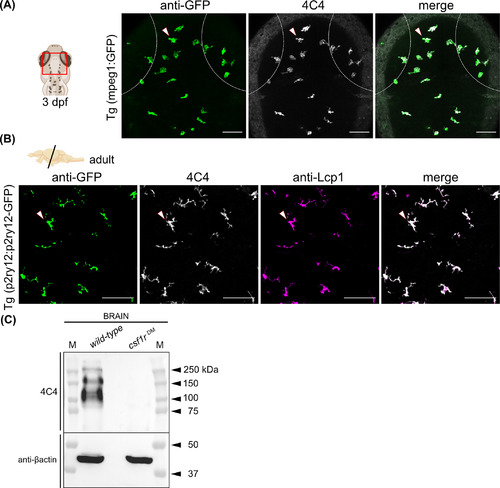
The 4C4 antibody labels microglial cells in the embryonic and adult zebrafish brain. (A) Dorsal view (red rectangle) of the optic tectum of a Tg(mpeg1:GFP) embryo at 3 dpf coimmunostained with the 4C4 antibody. Anti-GFP (green), 4C4 (gray), and merge of the two channels are shown. Dashed lines represent the eye edges. Images were taken using a 25× water-immersion objective. (B) Immunofluorescence on transversal brain sections (14 μm) from adult Tg(p2ry12-p2ry12:GFP) zebrafish co-immunostained with 4C4 and anti-Lcp1 (L-plastin) antibodies. Anti-GFP (green), 4C4 (gray), anti-Lcp1 (magenta), and merge of the three channels. Images were taken using a 20× objective. Images in (A) and (B) correspond to orthogonal projections and the white arrowheads point to microglial cells. Scale bars 50 μm. dpf, days postfertilization. (C) Detection of the 4C4 target protein by western blot. Protein lysate from a wild-type and a csf1rDM mutant adult brain. Βactin was used as a loading control. M, protein marker
EXPRESSION / LABELING:
PHENOTYPE:
|
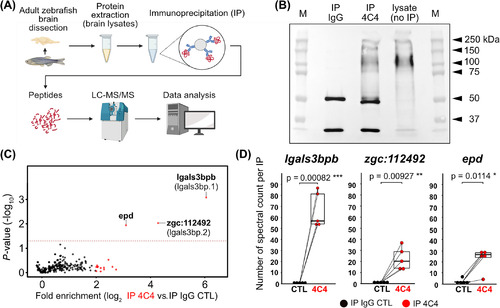
Identification of candidate 4C4 antigens by proteomic analysis. (A) Antigen identification strategy, from sample preparation to LC-MS analysis. (B) Immunoprecipitation (IP) of the target protein detected by western blot using the 4C4 antibody. Full blot showing: IP using the control isotype antibody IgGk1 (IP IgG), IP using the 4C4 antibody (IP 4C4), brain lysate as a positive control (lysate). The two bands detected in the IP samples correspond to the heavy and light chains (~50 and 25 kDa) of the primary antibody that are being recognized by the secondary antibody. M, protein marker; kDa, kilodaltons. (C) Volcano plot of averaged enrichment of protein in 4C4 (IP 4C4) vs. IgGk control (IP IgG CTL) immunoprecipitations. Red dots: enriched proteins (Fold change ≥ 2) P-value < 0.05. (D) Reproducibility boxplot of the total number of spectral counts quantified in each IP linked by pair (n = 5 independent experiments) for the three most significantly enriched proteins are shown. ***P < 0.001, **P < 0.01, *P < 0.05; paired t-test. LC-MS/MS, liquid chromatography-tandem mass spectrometry
EXPRESSION / LABELING:
|
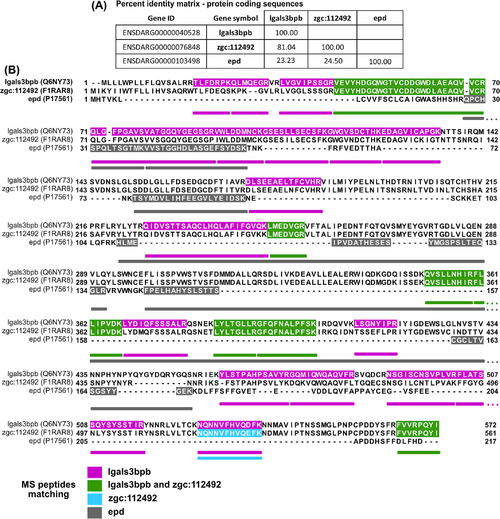
Mapping of the proteotypic peptides shows specificity for the Lgals3bpb sequence. (A) Sequence identity (%) between the coding sequences of lgals3bp, zgc:112492 and ependymin. Alignment performed using Clustal Omega (EMBL-EBI) (B) Multiple sequence alignment of the coding sequences of lgals3bpb, zgc:112492, and ependymin with the identified peptides remapped on each sequence. Colors indicate the proteotypicity or group specificity of each identified tryptic peptide. The gene symbol and the UniProtKB identifier are shown. MS, mass spectrometry
|
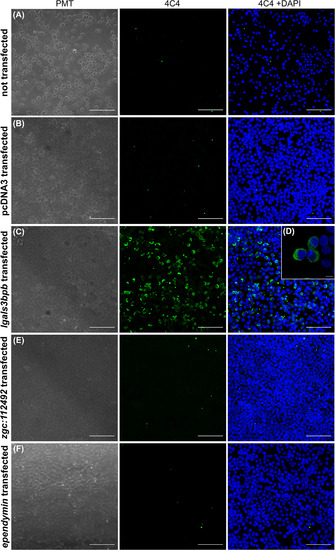
Validation of lgals3bpb as the 4C4 antigen by recombinant protein expression in HEK293T cells. (A-E) Immunofluorescence of HEK293T cells (A) or following transfection with the empty pcDNA3 plasmid (B), lgals3bpb (C,D), zgc:112492 (E) or ependymin (F) coding sequences. Bright field (PMT), 4C4 staining (green) and 4C4 with DAPI staining (blue) staining channels are shown (three independent experiments). (D) High magnification from pcDNA3-lgals3bpb-transfected cells. Scale bar 10 μm. Image was taken using a 40× water-immersion objective and a numerical zoom of 3. A c-myc tag (magenta) was used to validate the endogenous expression of the transfected genes (two independent experiments). Scale bars 100 μm. Images were taken using a 20× objective
|
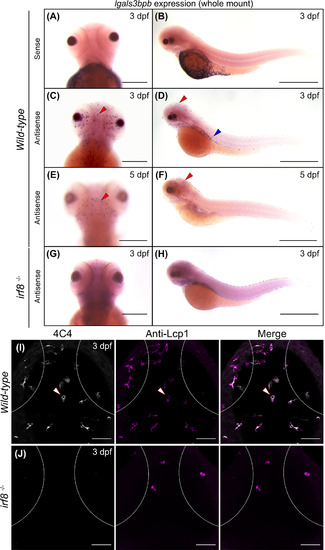
Expression of lgals3bpb in 3 dpf microglia. Whole mount in situ hybridization (WISH) for lgals3bpb sense (A,B) and antisense (C,D) probes in 3 dpf larvae. (C) Dorsal view shows positive staining in the brain in comparison with the sense probe (A). Red arrowheads indicate microglial cells. Scale bar 200 μm. (D) Lateral view shows positive staining in the brain (red arrowhead) as well as in the trunk (blue arrowhead). (E,F) WISH for lgals3bpb in 5 dpf larvae in dorsal and lateral view. Scale bars 200 and 500 μm. (G,H) WISH in irf8−/− mutants at 3 dpf shows absence of lgals3bpb expression in dorsal and lateral view. Scale bars 200 μm and 500 μm. (I,J) Dorsal view of the optic tectum in wild-type and irf8−/− mutants embryos at 3 dpf immunostained with 4C4 (gray) and anti-Lcp1 (magenta) antibodies. Dashed lines represent the eye edges. Images were taken using a 25× water-immersion objective. dpf, days postfertilization
EXPRESSION / LABELING:
PHENOTYPE:
|
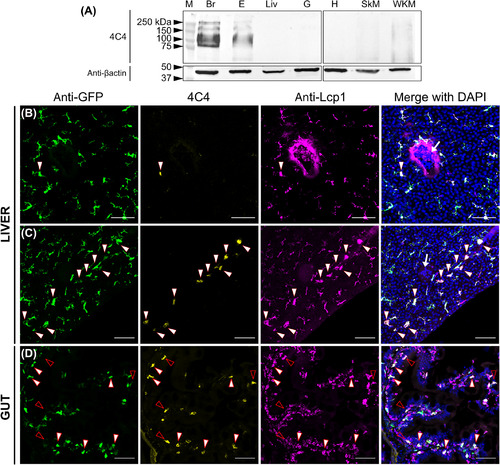
Expression of lgals3bpb among adult tissues. (A) Tissue distribution by western blot, using the 4C4 antibody and βactin as a loading control. Br, brain; E, eyes; Liv, liver, G, gut; H, heart; SkM, skeletal muscle; WKM, whole kidney marrow (n = 3 fish/tissue). kDa, kilodaltons. (B-D) Immunofluorescence on liver (C,D) and gut (E) sections (14 μm) from an adult Tg(mpeg1:GFP) fish. Anti-GFP (green), 4C4 (yellow), anti-Lcp1 (magenta), and a merge including DAPI staining of the three channels are shown. White arrowheads point to GFP+ 4C4+ Lcp1+ cells while empty arrowheads point to GFP− 4C4+ Lcp1+ cells. White arrow in (C) and (D) merged channels show erythrocyte nuclei indicating the presence of a vessel. Images were taken using a 20× objective and correspond to orthogonal projections. (n = 2). Scale bars 50 μm
EXPRESSION / LABELING:
|