
Image
|
Figure Caption
Fig. 2
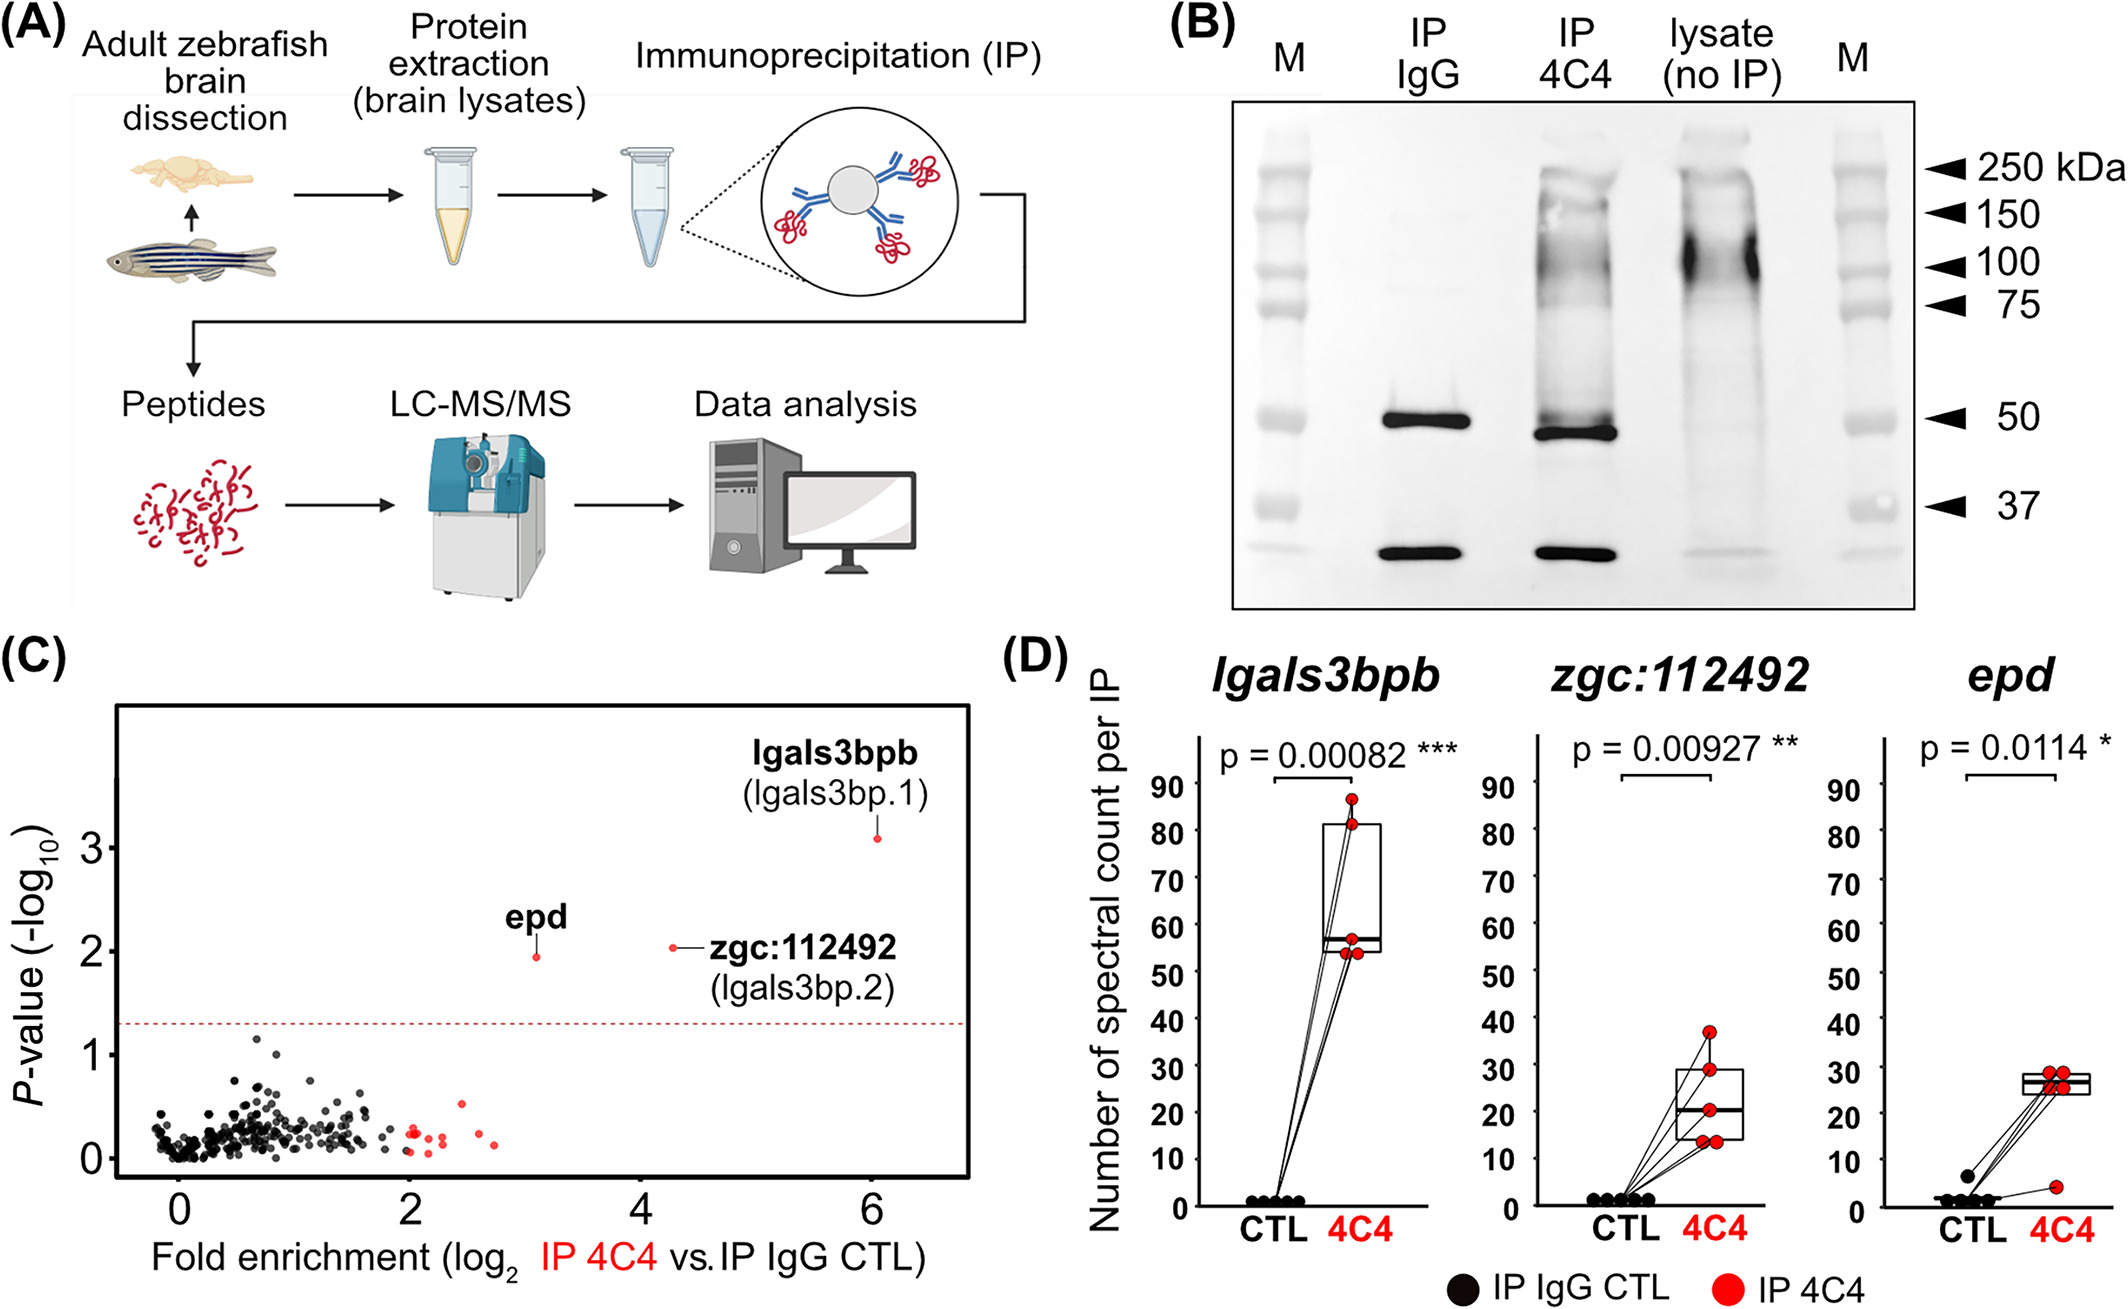
Identification of candidate 4C4 antigens by proteomic analysis. (A) Antigen identification strategy, from sample preparation to LC-MS analysis. (B) Immunoprecipitation (IP) of the target protein detected by western blot using the 4C4 antibody. Full blot showing: IP using the control isotype antibody IgGk1 (IP IgG), IP using the 4C4 antibody (IP 4C4), brain lysate as a positive control (lysate). The two bands detected in the IP samples correspond to the heavy and light chains (~50 and 25 kDa) of the primary antibody that are being recognized by the secondary antibody. M, protein marker; kDa, kilodaltons. (C) Volcano plot of averaged enrichment of protein in 4C4 (IP 4C4) vs. IgGk control (IP IgG CTL) immunoprecipitations. Red dots: enriched proteins (Fold change ≥ 2) P-value < 0.05. (D) Reproducibility boxplot of the total number of spectral counts quantified in each IP linked by pair (n = 5 independent experiments) for the three most significantly enriched proteins are shown. ***P < 0.001, **P < 0.01, *P < 0.05; paired t-test. LC-MS/MS, liquid chromatography-tandem mass spectrometry
Figure Data
Acknowledgments
This image is the copyrighted work of the attributed author or publisher, and
ZFIN has permission only to display this image to its users.
Additional permissions should be obtained from the applicable author or publisher of the image.
Full text @ Dev. Dyn.