
- Title
-
Pals1a and aPKCλ are not essential for Schwann cell migration, division or myelination in zebrafish
- Authors
- Boueid, M.J., Mikdache, A., Lesport, E., Delespierre, B., Loisel-Duwattez, J., Degerny, C., Tawk, M.
- Source
- Full text @ Dev. Dyn.
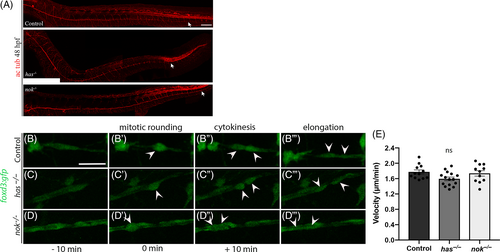
Pals1a and aPKCλ are not required for axonal growth or Schwann cell migration. (A) Acetylated tubulin expression in control (n = 12 embryos), has−/− (n = 12 embryos), and nok−/− (n = 11 embryos) embryos at 48 hpf showing the PLLn nerve (arrows). Scale bar = 100 μm. Still images from time-lapse imaging in Tg(foxd3:gfp) (B-B″') (5 cells, n = 3 embryos), Tg(foxd3:gfp)/has−/− (C-C″') (5 cells, n = 4 embryos), and Tg(foxd3:gfp)/nok−/− (D-D″') (6 cells, n = 3 embryos) embryos at around 32 hpf. Arrows indicate Schwann cells prior to and after cytokinesis. Scale bar = 25 μm. min, minutes. (E) Quantification of the velocity of Schwann cells in controls Tg(foxd3:gfp) (1.77 ± 0.05 μm/min, 12 cells, n = 4 embryos), Tg(foxd3:gfp)/has−/− (1.59 ± 0.04 μm/min, 15 cells, n = 4 embryos), and Tg(foxd3:gfp)/nok−/− (1.73 ± 0.07 μm/min, 11 cells, n = 4 embryos) during their migration along the PLLn between 28 and 34 hpf (P > .062 in all cases). ns, non-significant |
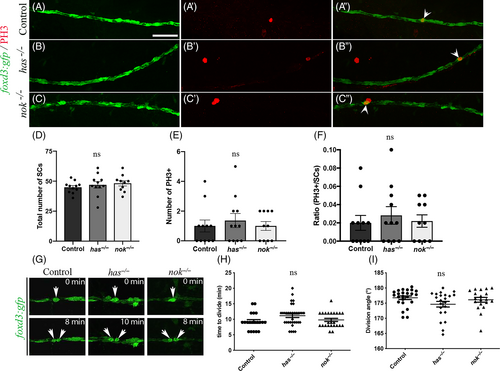
aPKCλ and Pals1a are not required for Schwann cell proliferation during radial sorting. PH3 immuno-labeling in Tg(foxd3:gfp) (A-A″), Tg(foxd3:gfp)/has−/− (B-B″), and Tg(foxd3:gfp)/nok−/− (C-C″) embryos at 48 hpf. Arrows indicate SC that are GFP and PH3 positives. Scale bar = 25 μm. (D) Quantification of the total number of SC within a defined region of the PLLn at 48 hpf in control Tg(foxd3:gfp) (44.91 ± 1.46 cells, n = 11 embryos), has−/−/Tg(foxd3:gfp) (46.91 ± 2.70 cells, n = 11 embryos), and nok−/−/Tg(foxd3:gfp) (48.20 ± 2.21 cells, n = 10 embryos) embryos (P > .79 in all cases). (E) Quantification of the number of PH3+/SC within a defined region of the PLLn at 48 hpf in control Tg(foxd3:gfp) (1 ± 0.40 cells, n = 11 embryos), has−/−/Tg(foxd3:gfp) (1.36 ± 0.47 cells, n = 11 embryos) and nok−/−/Tg(foxd3:gfp (1 ± 0.29 cells, n = 10 embryos) embryos (P > .79 in all cases). (F) Quantification of the ratio of PH3+ SC relative to the total number of SC within a defined region of the PLLn at 48 hpf in control Tg(foxd3:gfp) (0.02 ± 0.008, n = 11 embryos), has−/−/Tg(foxd3:gfp) (0.028 ± 0.009, n = 11 embryos), and nok−/−/Tg(foxd3:gfp (0.022 ± 0.006 cells, n = 10 embryos) embryos (P > .75 in all cases). (G) Still images from time-lapse imaging in Tg(foxd3:gfp), Tg(foxd3:gfp)/has−/−, and Tg(foxd3:gfp)/nok−/− embryos at around 50 hpf. Arrows indicate Schwann cells prior to and after cytokinesis. (H) Quantification of the time required for control (average of 9.30 ± 0.61 min, 20 cells, n = 4 embryos), has−/− (average of 11.15 ± 0.57 min, 34 cells, n = 7 embryos) and nok−/− (average of 9.79 ± 0.50 min, 24 cells, n = 6 embryos) Schwann cells to successfully complete cytokinesis. (ns, P > .05 in all cases). min, minutes. (I) Quantification of the angle measured along daughter Schwann cells during cytokinesis relative to axon position in control (average of 176.8 ± 0.58, 24 cells, n = 4 embryos), has−/− (average of 174.60 ± 0.92, 22 cells, n = 5 embryos), and nok−/− (average of 176.10 ± 0.79, 19 cells, n = 6 embryos) embryos (ns, P > .85 in all cases) |

Pals1a and aPKCλ are not required for Mbp expression and Nach clustering along the PLLn. (A) Lateral views of Mbp immuno-labeling in control, has−/− and nok−/− embryos at 3 dpf. Scale bar = 50 μm. (B) Quantification of Mbp fluorescence intensity along the PLLn in control (average of 31.71 ± 1.34, n = 4 embryos), has−/− (average of 30.37 ± 2.17, n = 5 embryos), and nok−/− (average of 30.5 ± 1.41, n = 4 embryos) embryos at 48 hpf (ns, P > .85 in all cases), a.u, arbitrary unit. Lateral views of Acetylated tubulin and NaCh labeling in control (C-C″), has−/−(D-D″), and nok−/− (E-E″) embryos at 3 dpf. Arrows indicate NaCh clustering along PLL axons. Scale bars = 5 μm. (F) Higher magnification of NaCh clusters in control, has−/− and nok−/− embryos respectively from left to right. Scale bar = 1 μm. (G) Graph depicting the number of sodium channels clusters observed within a defined region of the PLLn in the tail area at 3 dpf in control (5 ± 0.31 clusters; n = 7 embryos), has−/− (4.57 ± 0.29; n = 7 embryos), and nok−/− (4.57 ± 0.3; n = 7 embryos) embryos. (ns, P > .85 in all cases) |
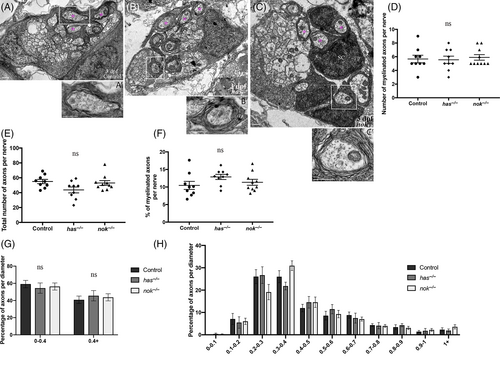
Pals1a and aPKCλ are not required for radial sorting and myelination by Schwann cells. TEM of a cross section of the PLLn at 3 dpf in control (A and A′), has−/− (B and B′), and nok−/− (C and C′) embryos. Magenta asterisks represent some large caliber myelinated axons. SC, Schwann cell. Scale bars = 0.5 μm. (D) Quantification of the number of myelinated axons per nerve at 3 dpf in control (average of 5.6 ± 0.55, 9 nerves, n = 5 embryos), has−/− (5.55 ± 0.53, 9 nerves, n = 5 embryos), and nok−/− (average of 5.9 ± 0.4, 10 nerves, n = 5 embryos) embryos. (ns, P > .87 in all other cases). (E) Quantification of the total number of axons per nerve at 3 dpf in control (average of 55 ± 2.85), has−/− (average of 43.67 ± 3.94), and nok−/− (average of 53 ± 3.22) embryos. (ns, P > .07 in all cases). (F) Quantification of the percentage of myelinated axons relative to the total number of axons per nerve at 3 dpf in control (average of 10.46 ± 1.14%), has−/− (average of 12.88 ± 0.73%), and nok−/− (average of 11.34 ± 0.85%) embryos. (ns, P > .18 in all cases). (G) Quantification of the percentage of axons relative to their diameter at 3 dpf in control (average of 59.15 ± 4.31% for 0-0.4 μm; average of 40.84 ± 4.2% for >0.4 μm), has−/− (average of 54.4 ± 5.99% for 0-0.4 μm; average of 45.59 ± 5.8% for >0.4 μm), and nok−/− (average of 56.3 ± 4.1% for 0-0.4 μm; average of 43.7 ± 4.2% for >0.4 μm) embryos. (ns, P > .87 in all cases). (H) Graph representing the distribution of axons relative to their diameter with 0.1 μm bin width at 3 dpf in control, has−/− and nok−/− embryos (ns, P > .999 in all cases) |
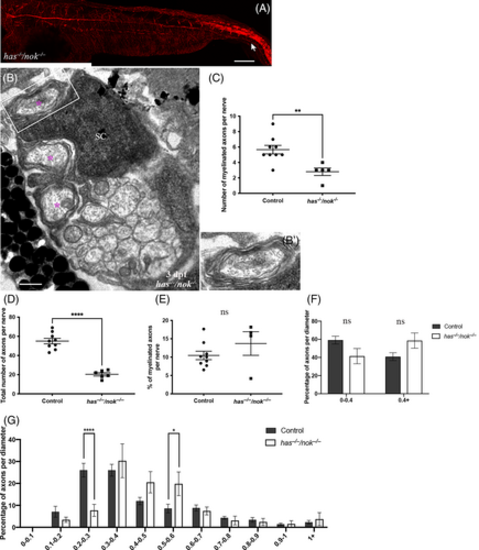
Schwann cells in has−/−/nok−/− double mutant do not show radial sorting or myelination defects. (A) Acetylated tubulin expression in has−/−/nok−/− embryo (n = 4 embryos) at 48 hpf (compare to Figure 1A). Scale bar = 100 μm. (B and B′) TEM of a cross section of the PLLn at 3 dpf in has−/−/nok−/− embryo (compare to Figure 4A,A′). Magenta asterisks represent some large caliber myelinated axons. SC, Schwann cell. Scale bars = 0.5 μm. (C) Quantification of the number of myelinated axons per nerve at 3 dpf in control (average of 5.6 ± 0.55, 9 nerves, n = 5 embryos) and has−/−/nok−/− (average of 2.75 ± 0.62, 5 nerves, n = 3 embryos) embryos (**P = .0024). (D) Quantification of the total number of axons per nerve at 3 dpf in control (average of 55 ± 2.85) and has−/−/nok−/− (average of 19.4 ± 1.72) embryos (****P ≤ .0001). (E) Quantification of the percentage of myelinated axons relative to the total number of axons per nerve at 3 dpf in control (average of 10.46 ± 1.14%) and has−/−/nok−/− (average of 13.70 ± 3.20%) embryos. (ns, P = .39). (F) Quantification of the percentage of axons relative to their diameter at 3 dpf in control (average of 59.15 ± 4.31% for 0-0.4 μm; average of 40.84 ± 4.2% for >0.4 μm) and has−/−/nok−/− (average of 41.44 ± 8.4% for 0-0.4 μm; average of 58.55 ± 8.5% for >0.4 μm) embryos. (ns, P > .09). (G) Graph representing the distribution of axons relative to their diameter with 0.1 μm bin width at 3 dpf in control and has−/−/nok−/− embryos (****P < .0001; *P = .024) |