
|
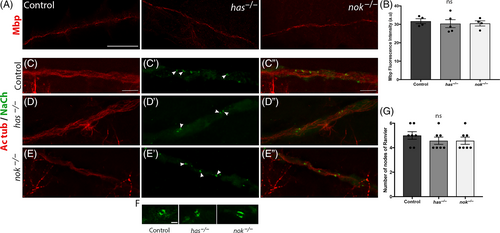
Fig. 3 Pals1a and aPKCλ are not required for Mbp expression and Nach clustering along the PLLn. (A) Lateral views of Mbp immuno-labeling in control, has−/− and nok−/− embryos at 3 dpf. Scale bar = 50 μm. (B) Quantification of Mbp fluorescence intensity along the PLLn in control (average of 31.71 ± 1.34, n = 4 embryos), has−/− (average of 30.37 ± 2.17, n = 5 embryos), and nok−/− (average of 30.5 ± 1.41, n = 4 embryos) embryos at 48 hpf (ns, P > .85 in all cases), a.u, arbitrary unit. Lateral views of Acetylated tubulin and NaCh labeling in control (C-C″), has−/−(D-D″), and nok−/− (E-E″) embryos at 3 dpf. Arrows indicate NaCh clustering along PLL axons. Scale bars = 5 μm. (F) Higher magnification of NaCh clusters in control, has−/− and nok−/− embryos respectively from left to right. Scale bar = 1 μm. (G) Graph depicting the number of sodium channels clusters observed within a defined region of the PLLn in the tail area at 3 dpf in control (5 ± 0.31 clusters; n = 7 embryos), has−/− (4.57 ± 0.29; n = 7 embryos), and nok−/− (4.57 ± 0.3; n = 7 embryos) embryos. (ns, P > .85 in all cases)