
- Title
-
Zebrafish Slit2 and Slit3 Act Together to Regulate Retinal Axon Crossing at the Midline
- Authors
- Davison, C., Bedó, G., Zolessi, F.R.
- Source
- Full text @ J Dev Biol
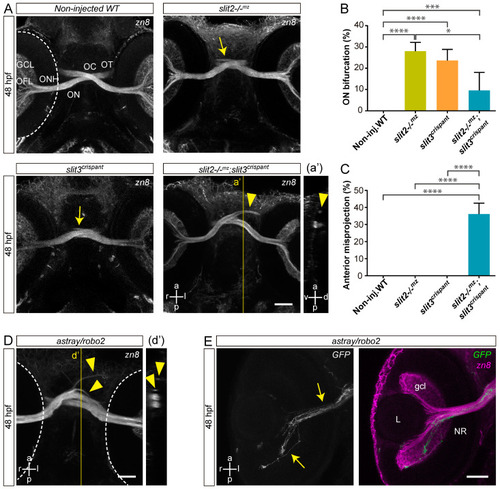
Simultaneous loss of Slit2 and Slit3 causes retinal axon misprojections at the optic chiasm I: gross phenotype and comparison with Robo2 loss. (A). Maximum intensity z-projections of the cephalic region of 48 hpf embryos immunostained to label RGCs (zn8 antibody; ventral view). Optic nerve bifurcation can be observed in slit2−/−mz embryos and slit3 crispants (arrows). Injection of slit3 sgRNA/nCas9n in slit2−/−mz embryos results in more severe defects at the optic chiasm, including anterior projections of the optic nerves (arrowhead), clearly observed in the orthogonal section in a’. (B,C). Penetrance of the bifurcation phenotype (B) and the anterior projection phenotype (C). n embryos (n independent experiments) = 81 (3) non-injected controls, 53 (3) slit2−/−mz, 57 (3) slit3 crispants, 70 (3) slit2−/−mz;slit3 crispants; mean ± SD of the three experiments is shown; level of statistical significance shown as asterisks (*: p < 0.05; ***: p < 0.005; ****: p < 0.001) and analyzed using the Fisher’s exact test for proportions. (D). Maximum intensity z-projection of the cephalic region of a 48 hpf astray/robo2 embryo immunostained to label RGCs (zn8 antibody; ventral view). Defects can be observed at the optic chiasm, including anterior projections of the optic nerves (arrowhead), clearly evidenced in the orthogonal section in d’ (E). Maximum intensity z-projection of the retina of a 48 hpf astray/robo2 embryo injected with atoh7:EGFP-CAAX DNA, where only the contralateral retina was labeled. Axons from labeled RGCs can be seen growing into the contralateral eye through the optic nerve (arrows). Dashed lines: outer retinal borders. GCL: ganglion cell layer; L: lens; NR: neural retina; OC: optic chiasm; OFL: optic fiber layer; ON: optic nerve; ONH: optic nerve head; OT: optic tract. Scale bars: (A), 40 μm; (D,E), 30 μm. See Video S1. |
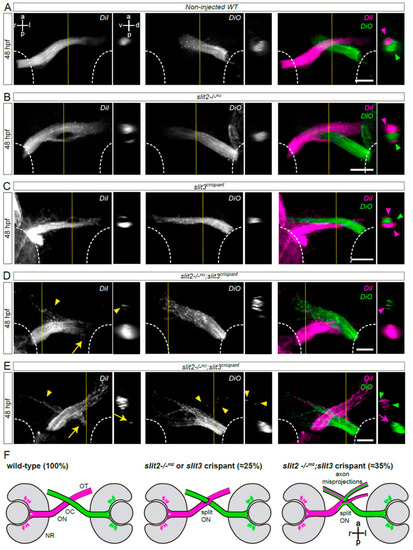
Simultaneous loss of Slit2 and Slit3 causes retinal axon misprojections at the optic chiasm II: anterograde axon labeling analysis. RGC axons from both eyes were anterogradely labeled through DiI or DiO injection into the retina, and images show the optic chiasm region (ventral view). (A–E) Maximum intensity z-projections of the midline region of 48 hpf of non-injected wild-type (A), slit2−/−mz (B), slit3 crispant (C) and slit2−/−mz;slit3 crispant (D,E) embryos. Arrowheads: projections into the ipsilateral optic tract. Arrows: projections into the contralateral optic nerve. (F). Diagrams summarizing the main phenotypic features of each experimental situation shown in this and the previous figures. NR: neural retina; OC: optic chiasm; ON: optic nerve; OT: optic tract. Scale bars: 30 μm. See Video S2. |
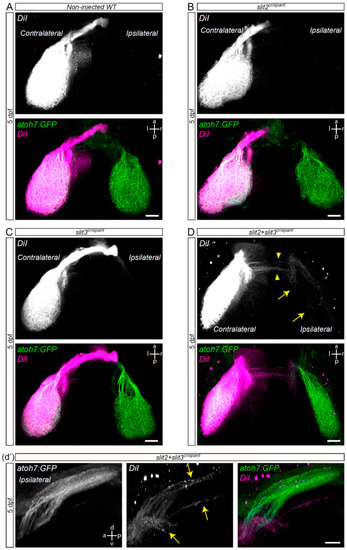
Retinal axons from slit2 + slit3 crispants innervate the ipsilateral optic tectum. Retinotopic anterograde RGC axon DiI labeling in atoh7:Gap43-EGFP (atoh7:GFP) transgenic larvae. (A–D). Horizontal maximum intensity z-projections of the cephalic region of 5 dpf larvae, where both the contralateral and ipsilateral tecta can be observed (dorsal view). Non-injected wild-type (A), slit2 crispant (B), slit3 crispant (C) and slit2 + slit3 crispant (D) larvae are shown. DiI-labeled axons are observed in the ipsilateral tectum of slit2 + slit3 crispants (arrows), and can be better visualized in the rotated view in d’. DiI-labeled axons can also be observed crossing the midline at a site slightly posterior to the optic tract (arrowheads). Scale bars: (A–D), 30 μm; (d’), 20 μm. See Video S3. |
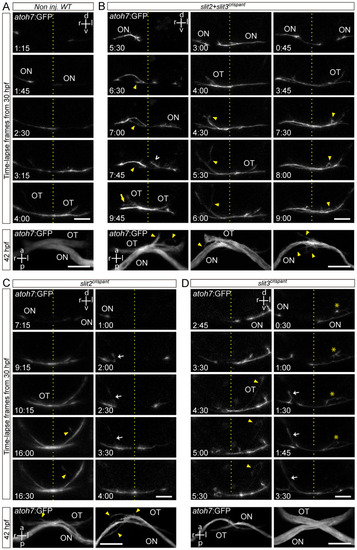
Retinal axons from slit2, slit3 and slit2/slit3 double crispants present navigation errors around the midline. Confocal time lapse observations of pioneer optic axon growth along the area surrounding the optic chiasm, in atoh7:Gap43-EGFP (atoh7:GFP) transgenic embryos. (A–D). Sequences of selected frames from time-lapse analysis of non-injected wild-type (A), slit2 + slit3 crispant (B), slit2 crispant (C) and slit3 crispant (D) embryos. A frontal view of the chiasm area is shown, starting with the appearance of the first axon at the optic nerve. The dashed lines indicate the location of the midline. Maximum intensity z-projections of the corresponding embryos are shown at the bottom of each time-lapse sequence, in ventral view. Misrouted axons were classified and quantified (Table 2) as follows: projections to the ipsilateral optic tract (e.g., white arrows), projections to the contralateral optic nerve (e.g., yellow arrow), fasciculation defects (e.g., asterisks), and immediately corrected minor pathfinding errors (e.g., empty white arrowhead). Yellow arrowheads point to other errors seen in these images. ON: optic nerve; OT: optic tract. Scale bars: 30 µm. See Videos S4–S8. |
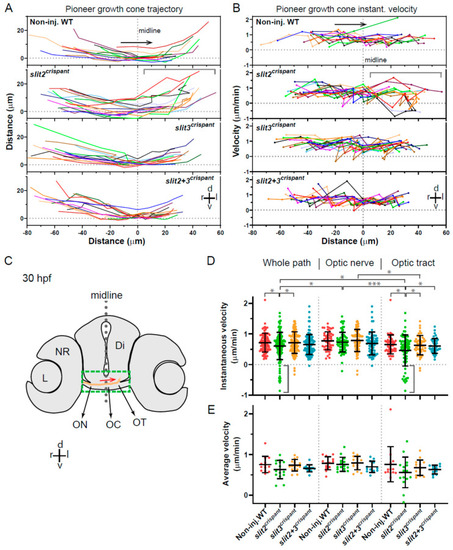
Tracking of pioneer axon growth through the optic chiasm highlights differential effects of Slit2 and Slit3 loss I: analysis of axon trajectories and velocities. 2D tracking analysis of RGC axon growth along the optic nerve, optic chiasm and proximal optic tract, from time-lapse experiments starting at 30 hpf, shown in Figure 4. (A). Axon trajectories across the ventro-dorsal and medio-lateral axes, for non-injected and crispant embryos. The gray bracket marks an area of higher spatial dispersion and/or apparent axon growth deviations in the slit2 crispants. (B). Instantaneous growth cone velocities compared to the medio-lateral axis along the optic pathway. The gray bracket marks an area of higher velocity dispersion and/or apparent axon growth deviations in the slit2 crispants. (C). Diagram showing a cross-section of a 30 hpf zebrafish embryo at the level of the optic chiasm, highlighting the approximate area analyzed in the time-lapse tracking experiments, with an example of the trajectory of a wild-type axon. Di: diencephalon; L: lens; NR: neural retina; OC: optic chiasm; ON: optic nerve; OT: optic tract. (D,E). Instantaneous velocities for the four experimental situations, analyzed as a pool (D) or averaged per embryo (E). In all cases, the data were analyzed and compared either for the whole axon path tracked, the optic nerve portion or the optic tract portion, as noted at the top. The gray brackets in (D) highlight several negative velocity values in the slit2 crispants. Mean ± SD; statistical significance is shown as asterisks (*: p < 0.05; ***: p < 0.005) and analyzed using the Brown-Forsythe and Welch test for multiple comparisons. |
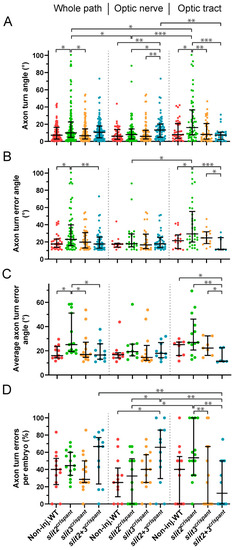
Tracking of pioneer axon growth through the optic chiasm highlights differential effects of Slit2 and Slit3 loss II: analysis of axon turn angles. The axon growth tracking data shown in Figure 5 were analyzed to retrieve the axon turn angle for each point, relative to the previous direction, after correcting for the curvature and converting to absolute values. In all cases, the data were analyzed and compared either for the whole axon path tracked, the optic nerve portion or the optic tract portion, as noted at the top. (A). Pooled angles for each experimental situation. (B,C). Angles larger than 10.4° (“axon turn errors”) were separated and analyzed as a pool (B) or averaged per embryo (C). (D). Number of axon turn errors per embryo, for each experimental situation, shown as a percentage of total determined angles. Median ± interquartile range; statistical significance is shown as asterisks (*: p < 0.05; **: p < 0.01; ***: p < 0.005) and analyzed using the Kruskal–Wallis test for multiple comparisons (only biologically relevant differences are marked). |
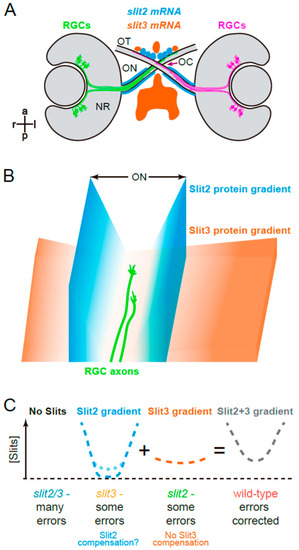
Graphical summary. (A). Expression patterns of slit2 and slit3 in a wild-type zebrafish embryo, around the stage of retinal axon crossing at the chiasm, as determined by fluorescent in situ hybridization, and described in Chalasani et al. [19] and Davison and Zolessi [17]. (B). Model illustrating how Slit2 and Slit3 might be cooperating in restricting RGC axons to the optic pathway around the optic chiasm, based on the original model described by Hutson and Chien [22]. Slit2 expression in a narrow area tightly associated with the optic nerve and tract would generate a short but steep gradient towards the pathway center. Slit3, on the other hand, is expressed in apparent larger amounts, but at a farther distance, probably making a longer and shallower gradient around the chiasm. The summation of both gradients would result in a “U” shaped Slit gradient, and axons would be able to grow just at the bottom of this “U”. (C). Application of this model to the four experimental situations analyzed in the present report. If no Slits are present, retinal axons are free to grow, but make guidance errors that are not corrected, because there is no repulsive channel. Slit3 deficiency leaves only the Slit2 gradient, which is still strong enough to correct most errors; this deficiency would also slightly increase slit2 expression, partially restoring the wild-type U gradient (dotted line). When there is a Slit2 deficiency, the remaining Slit3 gradient also allows for some uncorrected errors; there is no compensation in this case. Finally, in the wild-type situation, the full Slit (Slit2 + Slit3) “U”-shaped gradient keeps axons on track by correcting all errors. NR: neural retina; OC: optic chiasm; ON: optic nerve; OT: optic tract. |