
Figure 6
- ID
- ZDB-FIG-221029-27
- Publication
- Davison et al., 2022 - Zebrafish Slit2 and Slit3 Act Together to Regulate Retinal Axon Crossing at the Midline
- Other Figures
- All Figure Page
- Back to All Figure Page
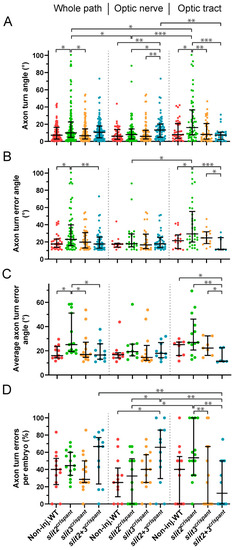
Tracking of pioneer axon growth through the optic chiasm highlights differential effects of Slit2 and Slit3 loss II: analysis of axon turn angles. The axon growth tracking data shown in Figure 5 were analyzed to retrieve the axon turn angle for each point, relative to the previous direction, after correcting for the curvature and converting to absolute values. In all cases, the data were analyzed and compared either for the whole axon path tracked, the optic nerve portion or the optic tract portion, as noted at the top. (A). Pooled angles for each experimental situation. (B,C). Angles larger than 10.4° (“axon turn errors”) were separated and analyzed as a pool (B) or averaged per embryo (C). (D). Number of axon turn errors per embryo, for each experimental situation, shown as a percentage of total determined angles. Median ± interquartile range; statistical significance is shown as asterisks (*: p < 0.05; **: p < 0.01; ***: p < 0.005) and analyzed using the Kruskal–Wallis test for multiple comparisons (only biologically relevant differences are marked). |