
Figure 1
- ID
- ZDB-FIG-221029-22
- Publication
- Davison et al., 2022 - Zebrafish Slit2 and Slit3 Act Together to Regulate Retinal Axon Crossing at the Midline
- Other Figures
- All Figure Page
- Back to All Figure Page
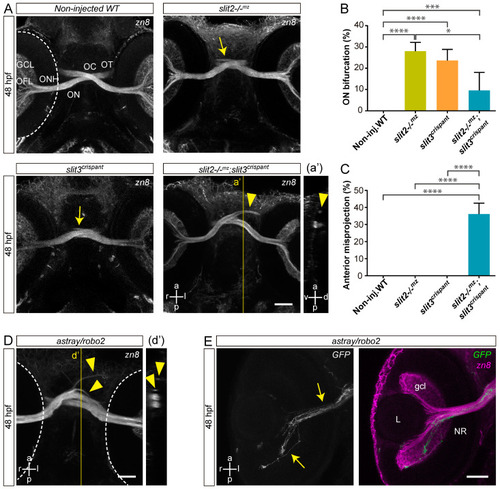
Simultaneous loss of Slit2 and Slit3 causes retinal axon misprojections at the optic chiasm I: gross phenotype and comparison with Robo2 loss. (A). Maximum intensity z-projections of the cephalic region of 48 hpf embryos immunostained to label RGCs (zn8 antibody; ventral view). Optic nerve bifurcation can be observed in slit2−/−mz embryos and slit3 crispants (arrows). Injection of slit3 sgRNA/nCas9n in slit2−/−mz embryos results in more severe defects at the optic chiasm, including anterior projections of the optic nerves (arrowhead), clearly observed in the orthogonal section in a’. (B,C). Penetrance of the bifurcation phenotype (B) and the anterior projection phenotype (C). n embryos (n independent experiments) = 81 (3) non-injected controls, 53 (3) slit2−/−mz, 57 (3) slit3 crispants, 70 (3) slit2−/−mz;slit3 crispants; mean ± SD of the three experiments is shown; level of statistical significance shown as asterisks (*: p < 0.05; ***: p < 0.005; ****: p < 0.001) and analyzed using the Fisher’s exact test for proportions. (D). Maximum intensity z-projection of the cephalic region of a 48 hpf astray/robo2 embryo immunostained to label RGCs (zn8 antibody; ventral view). Defects can be observed at the optic chiasm, including anterior projections of the optic nerves (arrowhead), clearly evidenced in the orthogonal section in d’ (E). Maximum intensity z-projection of the retina of a 48 hpf astray/robo2 embryo injected with atoh7:EGFP-CAAX DNA, where only the contralateral retina was labeled. Axons from labeled RGCs can be seen growing into the contralateral eye through the optic nerve (arrows). Dashed lines: outer retinal borders. GCL: ganglion cell layer; L: lens; NR: neural retina; OC: optic chiasm; OFL: optic fiber layer; ON: optic nerve; ONH: optic nerve head; OT: optic tract. Scale bars: (A), 40 μm; (D,E), 30 μm. See Video S1. |