
- Title
-
The regenerative response of cardiac interstitial cells
- Authors
- Rolland, L., Harrington, A., Faucherre, A., Abaroa, J.M., Gangatharan, G., Gamba, L., Severac, D., Pratlong, M., Moore-Morris, T., Jopling, C.
- Source
- Full text @ J. Mol. Cell Biol.
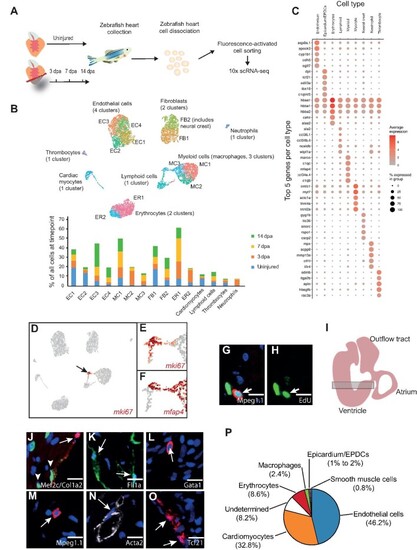
scRNA-seq analysis of regenerating zebrafish hearts. (A) Schematic of our scRNA-seq pipeline. (B) UMAP clusters of the different populations of cells and sub-clusters identified in zebrafish hearts. The graph shows the proportion of all the cells within individual clusters at each timepoint, e.g. EC1 contains 20% of all the cells in an uninjured ventricle, which drops to ∼5% at 3 dpa. ER, erythrocytes. (C) A DotPlot shows the 5 genes used to characterize the different cell types. (D–F) UMAP plot indicates the cluster of proliferating cells based on the expression of mki67. (E) The cluster pointed by the black arrow is shown at higher magnification. (F) The proliferating cluster shown contains mfap4+ myeloid cells (macrophages) and mfap4–lymphoid cells. |

Mesenchymal lineages and cardiac fibroblast activation in the regenerating zebrafish heart. (A) UMAP plot indicates the epicardial (purple) and neural crest (green) clusters. The black square delineates the area depicted in the subsequent UMAP plots. UMAP plots depict the relative expression of sox10 (neural crest; the black arrow indicates the neural crest cluster), rspo1, tcf21 (epicardium/EPDCs), |
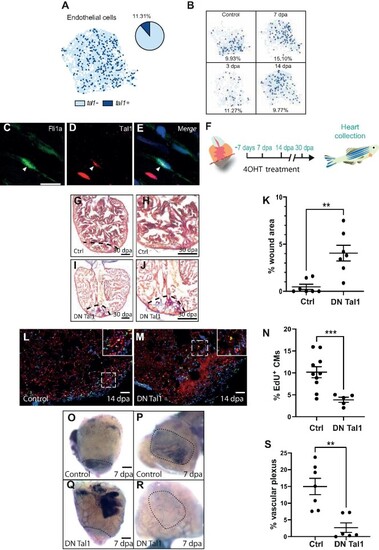
Tal1 is a regulator of the endothelial regenerative response. (A) UMAP plot of the endothelial cell cluster (light blue dots) shows that tal1 is expressed in a subset of these cells (dark blue dots). The pie chart indicates the total proportion of endothelial cells that express tal1. (B) UMAP plots of the endothelial population at different stages of regeneration (control/unamputated, 3 dpa, 7 dpa, and 14 dpa). The proportion of tal1-expressing endothelial cells (dark blue dots) is given as a percentage underneath each UMAP plot. (C–E) IHC analysis of endothelial cells. Fli1a+, green (C); Tal1+, red (D); a merged image (E). Scale bar, 10 μm. (F) Schematic of the 4OHT treatment. |
|
(Continued) (G–J) AFOG staining of a control (G and H) or DN Tal1-expressing (I and J) heart at 30 dpa. The black dashed line indicates the plane of amputation. The same images are shown in H and J at higher magnification, respectively. Note the presence of a large fibrin (red)/collagen (blue) scar. Scale bar, 200 μm. (K) The graph indicates then = 7, DN Tal1 n = 7). (L and M) EdU labelling of cycling cardiomyocytes in a control (L) or DN Tal1-expressing (M) heart. MEF2/cardiomyocytes (red), EdU (green). The dashed white box indicates the area shown at higher magnification in the inset. Scale bar, 100 μm. (N) The graph indicates the percentage of EdU+ cardiomyocytes in the entire ventricle (control n = 10, DN Tal1 n = 5). CMs, cardiomyocytes. ( |
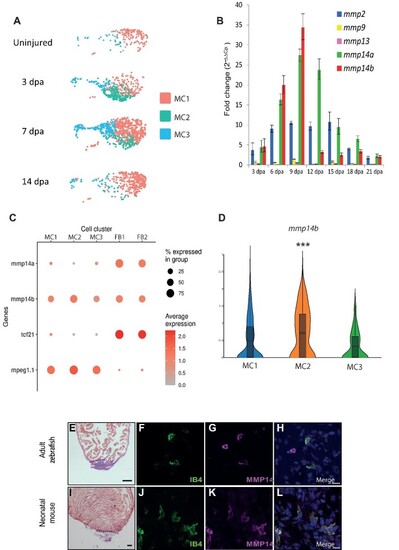
MMP14 is expressed by macrophages during cardiac regeneration. (A) UMAP plots of the macrophage population at different stages of regeneration (uninjured, 3 dpa, 7 dpa, and 14 dpa). The colored boxes indicate the different MCs (MC1, MC2, and MC3). (B) RT–qPCR analysis of mmp expression during cardiac regeneration. (C) A DotPlot shows the relative expression levels of mmp14a and mmp14b in macrophages (MC1, MC2, and MC3) and fibroblasts/epicardium (FB1 and FB2). tcf21 was used to identify the fibroblast population and mpeg1.1 was used to identify the macrophage population. (D) Violin plot compares the expression of mmp14b in MC1, MC2, and MC3. |
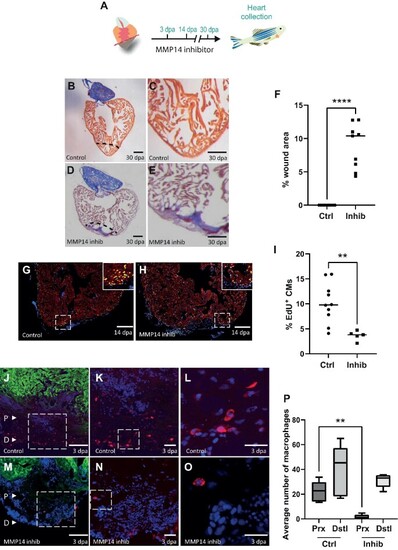
MMP14-expressing macrophages are required for cardiac regeneration. (A) Schematic of the inhibitor treatment protocol. (B and D) AFOG staining of a control (B) or NSC405020-treated (D) heart at 30 dpa. The black dashed line indicates the plane of amputation. Scale bar, 200 μm. (C and E) The same images as in B and D are shown at higher magnification, respectively. Note the presence of a large fibrin (red)/collagen (blue) scar. Scale bar, 100 μm. (F) The graph indicates the average area of the wound region as a percentage of the entire ventricle (n = 9). (G and H) EdU labelling of cycling cardiomyocytes in a control (G) or NSC405020-treated (H) heart. MEF2/cardiomyocytes (red), EdU (green). The dashed white box indicates the area shown at higher magnification in the inset. Scale bar, 200 μm. |
|
(Continued) (I) The graph indicates the percentage of EdU+ cardiomyocytes in the entire ventricle (control n = 10, inhibitor n = 5). (J–O) IHC on a 3 dpa control (J–L) or NSC405020-treated (M–O) zebrafish heart section for cardiomyocytes (GFP, green) and macrophages (IB4, red). (J and M) The letter P and the white arrow head point to proximal regions where macrophages were counted. The letter D and the white arrow head point to distal regions where macrophages were counted. Scale bar, 200 μm. (K and N) The regions highlighted by the dashed white box in J and M are magnified, respectively, which show macrophages in the wound region. Scale bar, 20 μm. (L and O) The regions highlighted by the dashed white box in K and N are magnified, respectively. Scale bar, 20 μm. (P) The graph indicates the average number of macrophages counted in either the proximal (Prx) or distalP-values were calculated using a non-parametric Mann–Whitney test. *P < 0.1, **P < 0.01, ***P < 0.001, ****P < 0.0001. |
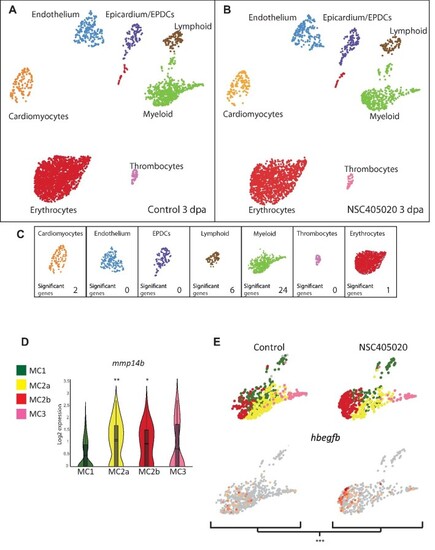
scRNA-seq analysis of control and MMP14 inhibitor-treated regenerating hearts. (A and B) UMAP clusters of the different populations of cells in control (A) and MMP14 inhibitor-treated (B) zebrafish hearts at 3 dpa. (C) The number of genes per cell type, which shows significantly differential expression between the control and MMP14 inhibitor-treated conditions (P < 0.1). (D) Violin plot compares the expression of mmp14b in MC1, MC2a, MC2b, and MC3 (*P < 0.1, **P < 0.05). (E) UMAP plots depict the relative expression of hbegfb in the different macrophage sub-clusters in control and MMP14 inhibitor-treated conditions (***P < 0.01). |