
|
Figure 4
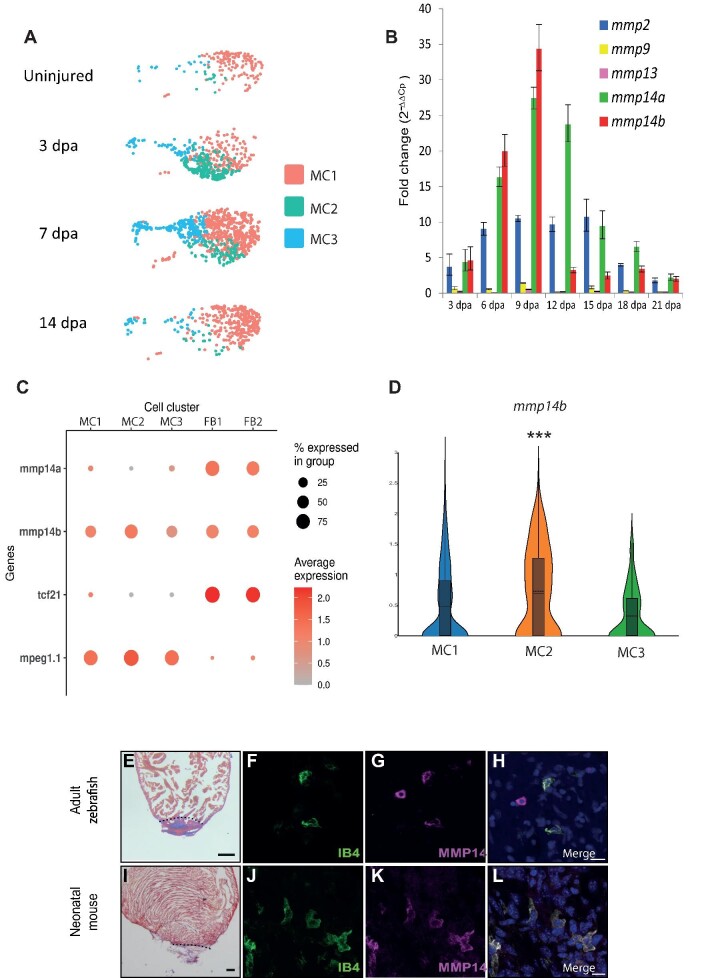
MMP14 is expressed by macrophages during cardiac regeneration. (A) UMAP plots of the macrophage population at different stages of regeneration (uninjured, 3 dpa, 7 dpa, and 14 dpa). The colored boxes indicate the different MCs (MC1, MC2, and MC3). (B) RT–qPCR analysis of mmp expression during cardiac regeneration. (C) A DotPlot shows the relative expression levels of mmp14a and mmp14b in macrophages (MC1, MC2, and MC3) and fibroblasts/epicardium (FB1 and FB2). tcf21 was used to identify the fibroblast population and mpeg1.1 was used to identify the macrophage population. (D) Violin plot compares the expression of mmp14b in MC1, MC2, and MC3.