
Figure 6
- ID
- ZDB-FIG-230406-89
- Publication
- Rolland et al., 2022 - The regenerative response of cardiac interstitial cells
- Other Figures
- All Figure Page
- Back to All Figure Page
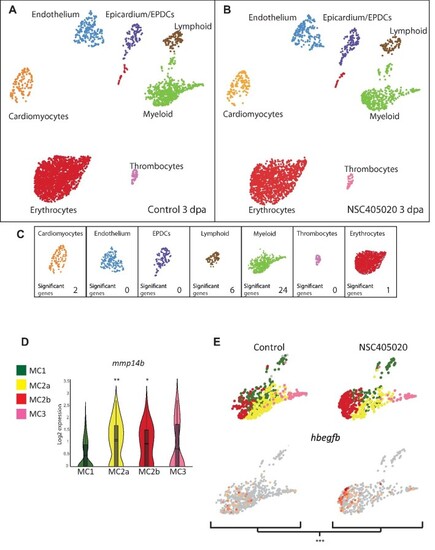
scRNA-seq analysis of control and MMP14 inhibitor-treated regenerating hearts. (A and B) UMAP clusters of the different populations of cells in control (A) and MMP14 inhibitor-treated (B) zebrafish hearts at 3 dpa. (C) The number of genes per cell type, which shows significantly differential expression between the control and MMP14 inhibitor-treated conditions (P < 0.1). (D) Violin plot compares the expression of mmp14b in MC1, MC2a, MC2b, and MC3 (*P < 0.1, **P < 0.05). (E) UMAP plots depict the relative expression of hbegfb in the different macrophage sub-clusters in control and MMP14 inhibitor-treated conditions (***P < 0.01). |