
- Title
-
Plasma proteome responses in zebrafish following λ-carrageenan-Induced inflammation are mediated by PMN leukocytes and correlate highly with their human counterparts
- Authors
- Charlie-Silva, I., Feitosa, N.M., Pontes, L.G., Fernandes, B.H., Nóbrega, R.H., Gomes, J.M.M., Prata, M.N.L., Ferraris, F.K., Melo, D.C., Conde, G., Rodrigues, L.F., Aracati, M.F., Corrêa-Junior, J.D., Manrique, W.G., Superio, J., Garcez, A.S., Conceição, K., Yoshimura, T.M., Núñez, S.C., Eto, S.F., Fernandes, D.C., Freitas, A.Z., Ribeiro, M.S., Nedoluzhko, A., Lopes-Ferreira, M., Borra, R.C., Barcellos, L.J.G., Perez, A.C., Malafaia, G., Cunha, T.M., Belo, M.A.A., Galindo-Villegas, J.
- Source
- Full text @ Front Immunol
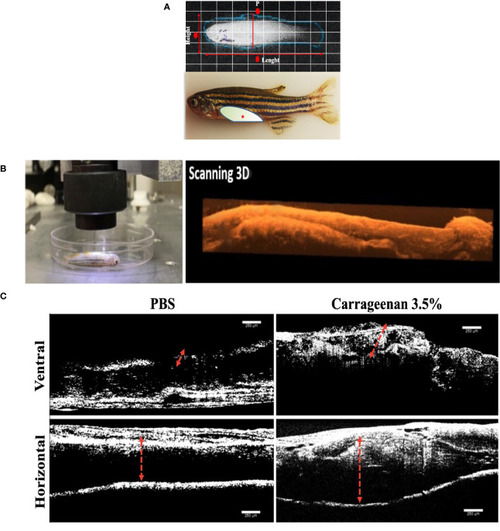
Characterization of the λ-CGN-induced abdominal edema model of inflammation in zebrafish (Danio rerio) male adults. (A) Representative images of healthy adult zebrafish at the beginning of the trial. (Upper panel) In vivo X-ray image (Xtreme system). (Lower panel) Real-time image of live zebrafish showing the λ-CGN injection site (red asterisk). The light color represents the abdominal cavity area forming edema analyzed in this study. (B) Live immobilized λ-CGN-induced male zebrafish specimens were evaluated one by one following a side and ventral pattern using a classical optical coherence tomography (OCT) device. The representative scanning 3D reconstruction is presented on the right side. (C) Spectral domain OCT images of a healthy and inflamed fish highlighting the edema boundaries and tissue disorganization (red dotted lines) on the ventral and horizontal superficial layers 4h post-injection of PBS or 3.5% λ-CGN, respectively. Scale bar 250 µm. |
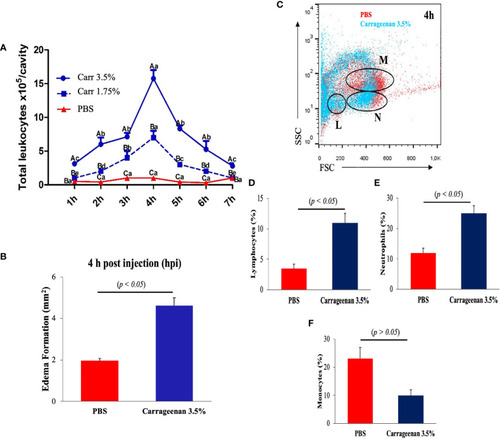
Intraperitoneal injection of λ-CGN stimulates a highly selective cellular immune response in zebrafish. (A) The time-dependent infiltrating mean number of total leukocytes in control (PBS) and λ-CGN-injected fish with two different concentrations. (B) Quantification of the progressive mean abdominal edema expansion using the highest (3.5%) λ-CGN concentration 4h after the injection. (C) Representative dot plot showing the gating used to discriminate between lymphocytes [L], neutrophils [N], and monocytes [M] present in the ascites recovered from the PBS (red) or 3.5% λ-CGN-treated (blue) fish 4h post-injection. (D–F) Quantification of data in (C) by cellular type. (Note the resulting inhibition in the monocyte fraction) (n = 21 fish per group) Results were analyzed using an unpaired t-test (p< 0.05) respective to the control value. Error bars indicate SD. |

Whole organism imaging of H&E-stained adult zebrafish enables the visualization of histology-like cross-sections. (A) Representative sagittal cross-section of adult wild-type zebrafish resulting after 4h post-injection of 3.5% λ-CGN by i.p. (B–E) The histopathological lesions recorded on selected tissues. (B) The projection showing detail of liver damage with the arrow indicating a leukocytes infiltration in the hepatic fracture caused by the induced swelling. (C) Pancreas with inflammation and recruited leukocytes present in the connective tissue capsule. (D) Dorsal muscle fibers at the edge of the peritoneal cavity showing muscular edema, the arrows highlight the infiltrating cells. (E) Ventral muscles denoting a clear inflammatory process on top of the muscularis and besides muscle packs. (n = 10). For reference the swim bladder-SB is indicated. Scale bar 50 µm. |

The inflammatory condition caused by λ-CGN extends along the entire boundaries of the peritoneal cavity. (A, B) Mesentery. (A-left) Basal condition showing the absence of reactive leukocytes in the mesenteric conjunction between the adipose cells and the pancreatic tissue. (A-right) In the mesentery of the 3.5% λ-CGN-induced swollen fish, extensive leukocyte infiltrates are observed after 4h. Note the vast leukocyte (yellow arrowheads) infiltrating the area and into the adjacent musculature. (B) Graphical representation of the leukocyte infiltrate counts per optical field (n = 10) in the λ-CGN treated fish. (C, D) Intestine. (C-left) Basal condition showing the unaltered physiological architecture of the intestine where epithelial cells, goblet cells and intestinal folds are clearly defined (gray arrows). (C-right) In the fish treated with 3.5% λ-CGN, obvious histopathological alterations and a strong reduction of fish intestinal loops and major structural components due to fluid accumulation (edema) are clearly observed (purple arrowheads). (D) Percentage quantification of the intestinal epithelia detachment (Left) and Goblet cells (Right) recorded in 10 fields per slide (n = 15 slides per condition) between the control and the λ-CGN-treated fish. Sections stained with hematoxylin-eosin. Objectives 40X; projective 2X. Staining: regular H&E-Harris. Scale bar 80μm at 40X. Results were analyzed using an unpaired t-test (p < 0.05) respective to the control value.Error bars indicate SD. |

Analysis of proteomics data. |
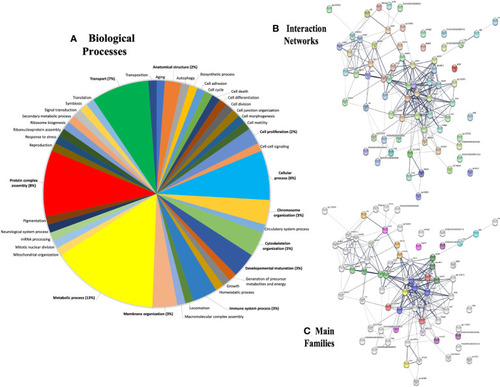
Gene ontology (GO) annotations retrieved from plasma proteins in the zebrafish λ-CGN-induced inflammatory reaction after 4h. |

Top functional proteins linked to the complement system identified in zebrafish plasma after 4h of acute inflammation induction with λ-CGN. (A) The abundance of the complement component proteins quantified by their activation and regulatory patterns. (A 1-7) Representations of the structural 3-D protein complement factors expressed in zebrafish (blue) plasma after the λ-CGN-induced inflammation overlap with their predicted Homo sapiens (red) homologous structures. The overall architecture of the membrane attack complex (MAC). (A 7) Upper rim assembly of the barrel (I), and the cytoplasmic amphipathic region (II). (B) The activity, regulation, and metabolism & cell kinetics of natural antibodies affecting the classical complement pathway. (B 1-3) Exposed 3D zebrafish proteins contrasted with those of H. sapiens. The values in the graphs are expressed in relative abundance of the sample average (n = 4). The structural analysis of the proteins is described in the methodology. Abundance increases denoted by asterisks. Data are representative of two repeated trials in which all samples were run in triplicate (Student’s t test, p < 0.05). Results were analyzed using an unpaired t-test (p < 0.05) respective to the control value. Error bars indicate SD. |

Characterization of three zebrafish orthologues of human catalytic enzymes participating in inflammatory processes mediated by λ-CGN. (A) The abundance of the intra- and extra-cellular superoxide dismutase (SOD) production and its role in zebrafish physiology, 4h post-injection with 3.5% λ-CGN. (A 1-2) Representations of the structural 3-D proteins in zebrafish (blue) plasma overlapping with their predicted Homo sapiens (red) homologous structures. (B) the abundance of the Lysozyme activity following the same setting as for SOD. (B 1) 3-D protein in zebrafish (blue) plasma overlapping with its predicted Homo sapiens (red) homologous structure. The values in the graphs are expressed as relative abundance of the sample average (n = 4). The structural analysis was obtained as described in the methodology. |

Activated polymorphonuclear leukocytes proteins orchestrate crucial inflammatory mechanisms 4h after λ-CGN injection in zebrafish. (A) The abundance of key proteins of cellular metabolism and kinetics, activity, and regulation is displayed. (A 1-12) Representation of the structural 3-D proteins in zebrafish (blue) plasma overlapping with their predicted Homo sapiens (red) homologous structures. Several inducers, mediators, and regulators of inflammation were reconstructed (E.g., Elongation factor 1-alpha, Galectin, or Fructose-bisphosphate aldolase, respectively). Note the presence and high abundance of Ezrin A in zebrafish. This protein is widely used to predict the strength of the inflammatory response in vertebrates. (B) The abundance of the main proteins related to the acute phase of inflammation triggered by the λ-CGN injection in zebrafish is presented. Note the marked increase in activity that was recorded in the apolipoprotein (classes: A, C, E, and M) and the parvalbumin isoforms (1, 2, 3, and 4). (B 1-8) Major circulatory proteins of the acute phase of inflammation are triggered by the main PMN cell family (Neutrophils, Eosinophils, Basophils, and Mast cells). The values in the graphs are expressed as relative abundance of the sample average (n = 4). The structural analysis of the proteins is described in the methodology. Abundance increases denoted by asterisks. Data are representative of two repeated trials in which all samples were run in triplicate (Student’s t test, p < 0.05). Error bars indicate SD. |