
|
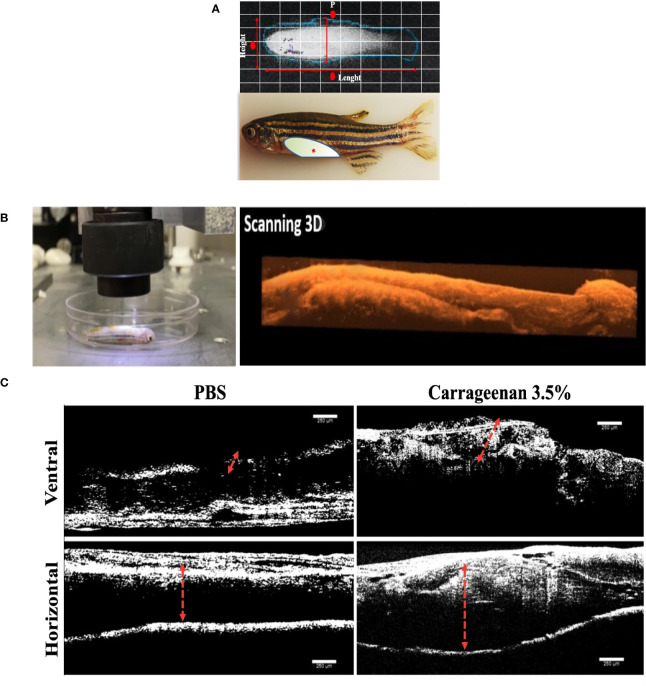
Figure 1
Characterization of the λ-CGN-induced abdominal edema model of inflammation in zebrafish (Danio rerio) male adults. (A) Representative images of healthy adult zebrafish at the beginning of the trial. (Upper panel) In vivo X-ray image (Xtreme system). (Lower panel) Real-time image of live zebrafish showing the λ-CGN injection site (red asterisk). The light color represents the abdominal cavity area forming edema analyzed in this study. (B) Live immobilized λ-CGN-induced male zebrafish specimens were evaluated one by one following a side and ventral pattern using a classical optical coherence tomography (OCT) device. The representative scanning 3D reconstruction is presented on the right side. (C) Spectral domain OCT images of a healthy and inflamed fish highlighting the edema boundaries and tissue disorganization (red dotted lines) on the ventral and horizontal superficial layers 4h post-injection of PBS or 3.5% λ-CGN, respectively. Scale bar 250 µm.