
|
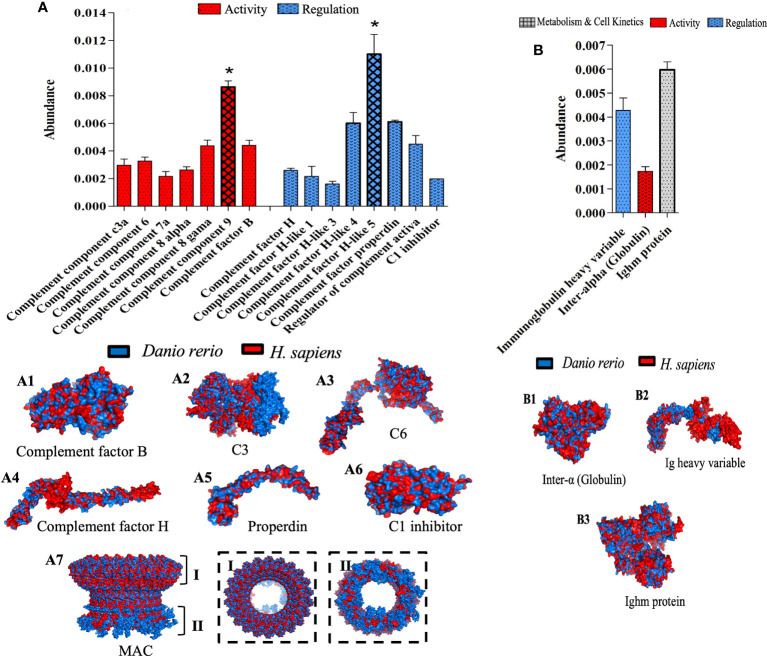
Figure 7
Top functional proteins linked to the complement system identified in zebrafish plasma after 4h of acute inflammation induction with λ-CGN. (A) The abundance of the complement component proteins quantified by their activation and regulatory patterns. (A 1-7) Representations of the structural 3-D protein complement factors expressed in zebrafish (blue) plasma after the λ-CGN-induced inflammation overlap with their predicted Homo sapiens (red) homologous structures. The overall architecture of the membrane attack complex (MAC). (A 7) Upper rim assembly of the barrel (I), and the cytoplasmic amphipathic region (II). (B) The activity, regulation, and metabolism & cell kinetics of natural antibodies affecting the classical complement pathway. (B 1-3) Exposed 3D zebrafish proteins contrasted with those of H. sapiens. The values in the graphs are expressed in relative abundance of the sample average (n = 4). The structural analysis of the proteins is described in the methodology. Abundance increases denoted by asterisks. Data are representative of two repeated trials in which all samples were run in triplicate (Student’s t test, p < 0.05). Results were analyzed using an unpaired t-test (p < 0.05) respective to the control value. Error bars indicate SD.