
- Title
-
Single-molecule tracking of Nodal and Lefty in live zebrafish embryos supports hindered diffusion model
- Authors
- Kuhn, T., Landge, A.N., Mörsdorf, D., Coßmann, J., Gerstenecker, J., Čapek, D., Müller, P., Gebhardt, J.C.M.
- Source
- Full text @ Nat. Commun.
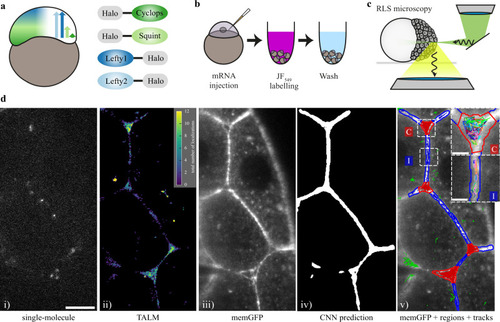
Single-molecule imaging of HaloTag-labeled Nodal and Lefty in live zebrafish embryos using RLSM.
a Schematic of the presumed concentration gradients of Nodal (dark and light green) and Lefty (dark and light blue) in early zebrafish embryos (left) and sketch of HaloTag fusion proteins of mature Cyclops, mature Squint, Lefty1 and Lefty2 (right). b Schematic of the labeling workflow: mRNA encoding the fusion proteins was injected at the one-cell stage. Embryos were incubated in medium containing the HaloTag JF-549 ligand to covalently label the HaloTag. Excess dye was removed in washing steps. c Sketch of a zebrafish embryo imaged with a reflected light-sheet microscope. d Workflow of single-molecule imaging and image segmentation: i) signal of single Lefty2-HaloTag molecules at 561 nm laser illumination for 10 ms; ii) tracking-and-localization-microscopy (TALM) image showing the total number of localizations over 1000 frames or 11.7 s in each 2 × 2 pixel bin; iii) memGFP signal at 488 nm laser illumination averaged over 10 × 10 ms frames, outlining cellular membranes; iv) region of interest (ROI) mask of the extracellular space predicted by a convolutional neural net (CNN) based on the memGFP signal; v) overlay of the memGFP signal, the manually curated ROI separating cell-cell-interfaces (blue, I) and extracellular cavities (red, C); tracks assigned to interfaces (blue), cavities (red) and not assigned (green) are also shown. Scale bar: 10 µm. Insets in v): zoom of the indicated interface and cavity including an example set of tracks. Scale bar: 2 µm. |
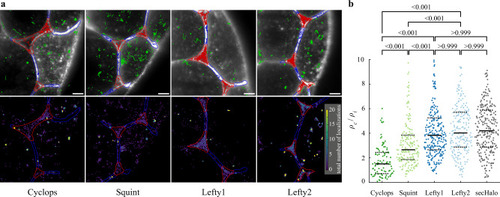
Localization of morphogens in cell-cell interfaces and extracellular cavities.
a Top: Overlay of the memGFP signal, the manually curated ROI separating cell-cell-interfaces (blue, I) and extracellular cavities (red, C); tracks assigned to interfaces (blue), cavities (red) and not assigned (green) are also shown. Bottom: Tracking-and-localization-microscopy (TALM) image showing the total number of localizations over 1000 frames or 11.7 s in each 2 × 2 pixel bin; scale bar: 5 µm. b Ratios of localization densities in cavities and interfaces calculated for each movie (for statistics see Supplementary Table 5). Values above 10 are not displayed (3.4% of all movies). p-values (Cyclops - Squint, Cyclops - Lefty1, Cyclops - Lefty2, Squint - Lefty1, Squint - Lefty2: <0.001; Lefty1 - Lefty2, Lefty1 - secHalo, Lefty2 -secHalo: >0.999) were calculated using the Kruskal-Wallis-Test. Solid black lines indicate the median values, dashed black lines the 0.25 and 0.75 quantiles. Source data are provided as a Source Data file for Fig. 2b. |
|
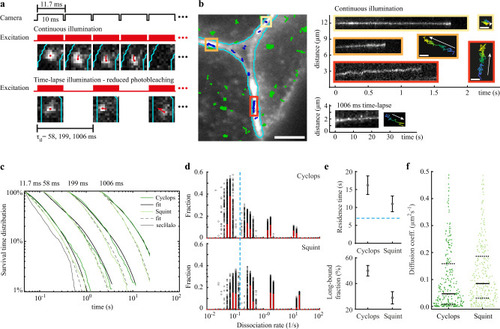
Residence times of Cyclops and Squint in the extracellular space.
a Overview of camera exposure and laser excitation patterns in time-lapse illumination experiments and representative images of single molecules overlaid with tracks (red) and the boundary of the extracellular region (cyan). b Left panel: Overlay of the memGFP signal (white) with the boundary of the extracellular region (cyan) and tracked Cyclops molecules from a movie with continuous illumination. Bound Cyclops molecules in the extracellular space shown in blue, intracellular molecules shown in green. Scale bar: 5 µm. Right panels: continuous illumination kymographs of the yellow, orange and red regions indicated in the left image and below a kymograph from a 1006 ms time-lapse movie as well as position plots of the tracks color-coded according to start (blue) and end (yellow) times. Scale bar: 0.3 µm. c Survival-time distributions of bound morphogens and sec-Halo in the time-lapse conditions indicated on top (dark and light green lines) and survival time functions obtained by GRID for Cyclops (solid black lines) and Squint (dashed black lines). d State spectra of dissociation rates of Cyclops and Squint obtained by GRID using all data (red bars) and 500 resampling runs with randomly selected 80% of data (black data points) as an error estimation of the spectra. The dashed blue line indicates the boundary for long-bound molecules of 0.15 s−1. e Residence times of Cyclops and Squint (top panel) and the corresponding fraction (bottom panel) obtained from the slowest dissociation rate cluster of the state spectra. Error bars denote s.d. of the resampled spectra in d). The dashed blue line indicates the boundary for long-bound molecules of 7 s. f Diffusion coefficients obtained from fitting the first 10 points of a mean-squared displacement plot of bound Cyclops and Squint molecules recorded for at least 20 frames (ntracks,cyc = 283, ntracks,squ = 337). Values above 0.5 µm²s−1 were discarded (11%). Solid black lines indicate the median values, dashed black lines are the 0.25 and 0.75 quantiles. For full experimental statistics see Supplementary Table 6. Source data are provided as a Source Data file for Fig. 4c, d, f. |
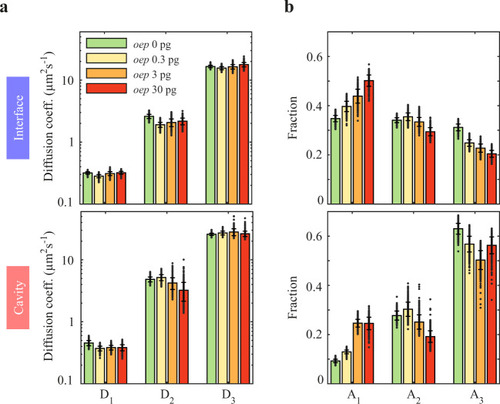
Mobility of Squint decreases with overexpression of oep.
a Diffusion coefficients and (b) fractions of the three-component diffusion model in interfaces and cavities for Squint at different amounts of mRNA encoding Oep. Data are represented as mean values ± s.d. from 500 resamplings with randomly selected 50% of the data. For full experimental statistics see Supplementary Table 5. Source data are provided as a Source Data file. |
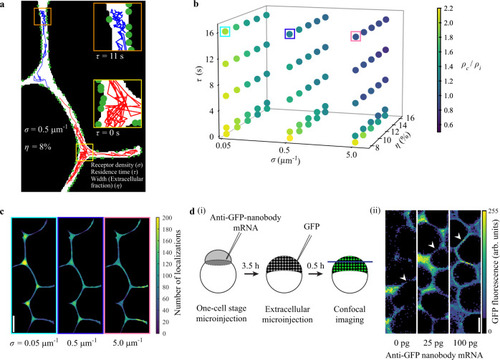
An agent-based model reveals key parameters affecting morphogen behavior in the extracellular space.
a Illustration of the model with a section of the two-dimensional simulation geometry showing simulated tracks (200 steps or 2 s) for two morphogens with residence times τ of 11 s (blue track) and 0 s (red track), respectively. Green circles indicate receptors. The receptor density σ is given as the number of receptors per µm of membrane length. The width of the extracellular region in terms of extracellular fraction is given by the parameter η. Morphogens are allowed to move in the extracellular space (white). A morphogen becomes ‘immobile’ or bound upon detecting a receptor in proximity and performs smaller jumps corresponding to the bound diffusion coefficient. b Three-dimensional scatter plot of simulated parameter combinations showing corresponding localization density ratios (ρc/ρi). Five residence times τ (0 s, 1 s, 6 s, 11 s, and 16 s), three receptor densities σ (0.05 μm−1, 0.5 μm−1, and 5.0 μm−1) and five extracellular fractions η (8%, 10%, 12%, 14%, and 16%) were simulated. c Localization density plots of simulated morphogens with increasing receptor densities σ (0.05 μm−1, 0.5 μm−1, and 5.0 μm−1; τ = 16 s, η = 8%). Frame colors correspond to colored boxes in b). d (i) Schematic depicting the experimental procedure to acquire confocal images of GFP localization in zebrafish embryos. (ii) Representative images of regions of interest used for GFP signal measurements. Cell-cell interface regions are indicated by arrowheads. Scale bars in c and d (ii) are 10 μm. n = 5 different regions of interest were measured per embryo and treatment; see Supplementary Fig. 9g for detailed statistical analysis. Source data are provided as a Source Data file for Fig. 6b. |