
|
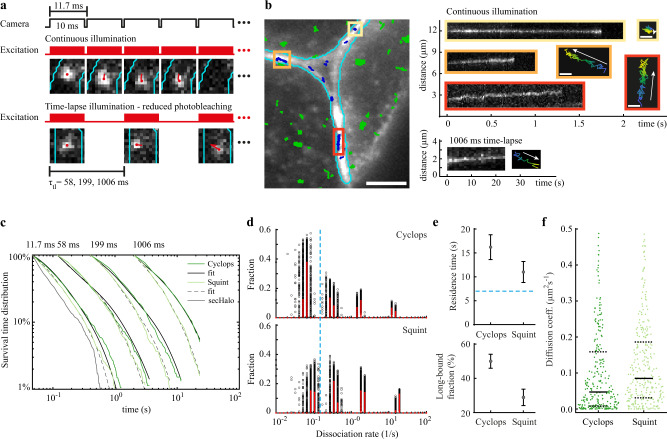
Fig. 4
a Overview of camera exposure and laser excitation patterns in time-lapse illumination experiments and representative images of single molecules overlaid with tracks (red) and the boundary of the extracellular region (cyan). b Left panel: Overlay of the memGFP signal (white) with the boundary of the extracellular region (cyan) and tracked Cyclops molecules from a movie with continuous illumination. Bound Cyclops molecules in the extracellular space shown in blue, intracellular molecules shown in green. Scale bar: 5 µm. Right panels: continuous illumination kymographs of the yellow, orange and red regions indicated in the left image and below a kymograph from a 1006 ms time-lapse movie as well as position plots of the tracks color-coded according to start (blue) and end (yellow) times. Scale bar: 0.3 µm. c Survival-time distributions of bound morphogens and sec-Halo in the time-lapse conditions indicated on top (dark and light green lines) and survival time functions obtained by GRID for Cyclops (solid black lines) and Squint (dashed black lines). d State spectra of dissociation rates of Cyclops and Squint obtained by GRID using all data (red bars) and 500 resampling runs with randomly selected 80% of data (black data points) as an error estimation of the spectra. The dashed blue line indicates the boundary for long-bound molecules of 0.15 s−1. e Residence times of Cyclops and Squint (top panel) and the corresponding fraction (bottom panel) obtained from the slowest dissociation rate cluster of the state spectra. Error bars denote s.d. of the resampled spectra in d). The dashed blue line indicates the boundary for long-bound molecules of 7 s. f Diffusion coefficients obtained from fitting the first 10 points of a mean-squared displacement plot of bound Cyclops and Squint molecules recorded for at least 20 frames (ntracks,cyc = 283, ntracks,squ = 337). Values above 0.5 µm²s−1 were discarded (11%). Solid black lines indicate the median values, dashed black lines are the 0.25 and 0.75 quantiles. For full experimental statistics see Supplementary Table 6. Source data are provided as a Source Data file for Fig. 4c, d, f.