|
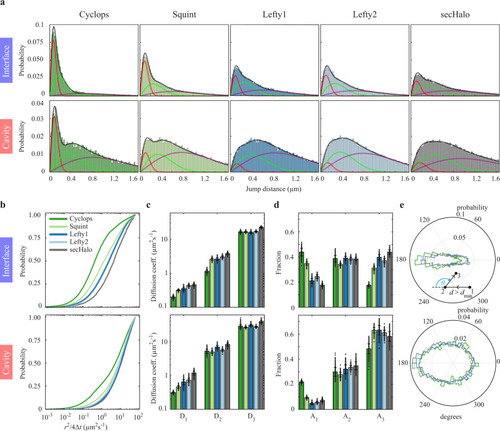
Mobility of morphogens in cell-cell interfaces and extracellular cavities.a Distribution of jump distances within single-molecule tracks in interfaces and cavities for the indicated morphogen and sec-Halo. Lines represent a three-component diffusion model (black) and the individual components (red, green, purple). b Cumulative distributions of jump distances. c) Diffusion coefficients and (d) fractions of the three-component diffusion model (Supplementary Table 1, 2). Data are presented as mean values ± s.d. from 500 resamplings with randomly selected 50% of the data. e Distribution of angles between two consecutive track segments. For full experimental statistics see Supplementary Table 5. Source data are provided as a Source Data file.
|