
|
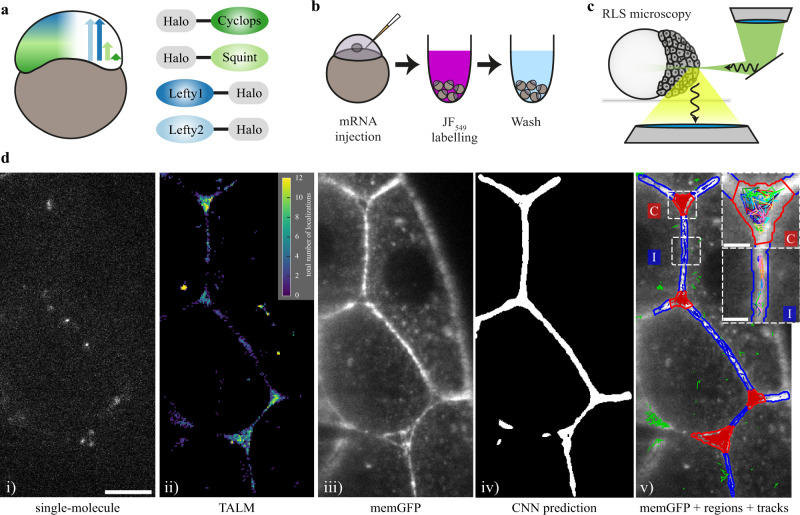
Fig. 1
a Schematic of the presumed concentration gradients of Nodal (dark and light green) and Lefty (dark and light blue) in early zebrafish embryos (left) and sketch of HaloTag fusion proteins of mature Cyclops, mature Squint, Lefty1 and Lefty2 (right). b Schematic of the labeling workflow: mRNA encoding the fusion proteins was injected at the one-cell stage. Embryos were incubated in medium containing the HaloTag JF-549 ligand to covalently label the HaloTag. Excess dye was removed in washing steps. c Sketch of a zebrafish embryo imaged with a reflected light-sheet microscope. d Workflow of single-molecule imaging and image segmentation: i) signal of single Lefty2-HaloTag molecules at 561 nm laser illumination for 10 ms; ii) tracking-and-localization-microscopy (TALM) image showing the total number of localizations over 1000 frames or 11.7 s in each 2 × 2 pixel bin; iii) memGFP signal at 488 nm laser illumination averaged over 10 × 10 ms frames, outlining cellular membranes; iv) region of interest (ROI) mask of the extracellular space predicted by a convolutional neural net (CNN) based on the memGFP signal; v) overlay of the memGFP signal, the manually curated ROI separating cell-cell-interfaces (blue, I) and extracellular cavities (red, C); tracks assigned to interfaces (blue), cavities (red) and not assigned (green) are also shown. Scale bar: 10 µm. Insets in v): zoom of the indicated interface and cavity including an example set of tracks. Scale bar: 2 µm.