
- Title
-
Zebrafish mutants reveal unexpected role of Lrp5 in osteoclast regulation
- Authors
- Khrystoforova, I., Shochat-Carvalho, C., Harari, R., Henke, K., Woronowicz, K., Harris, M.P., Karasik, D.
- Source
- Full text @ Front Endocrinol (Lausanne)
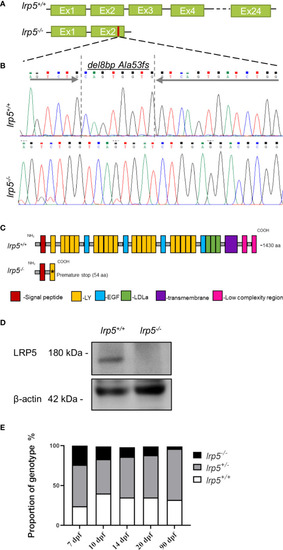
CRISPR-Cas9 induced |
|
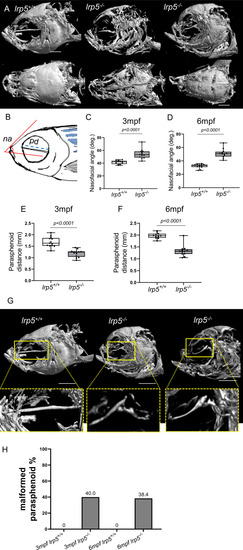
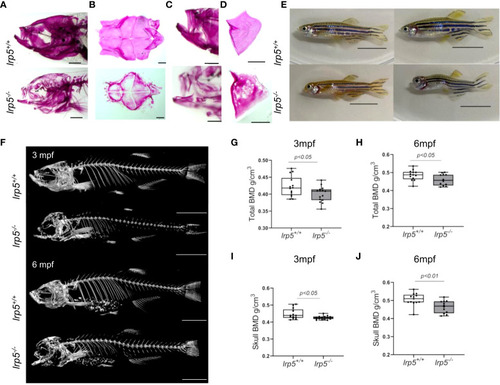
Craniofacial deformities of adult lrp5 mutant. PHENOTYPE:
|
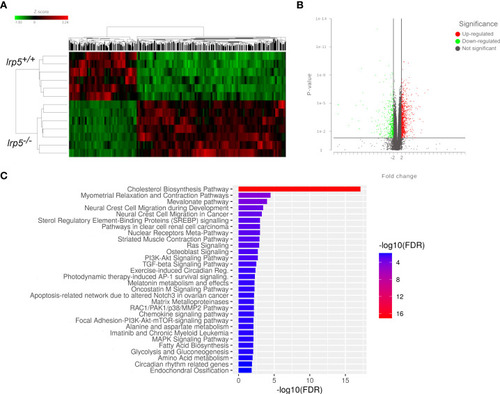
RNA-seq results. |
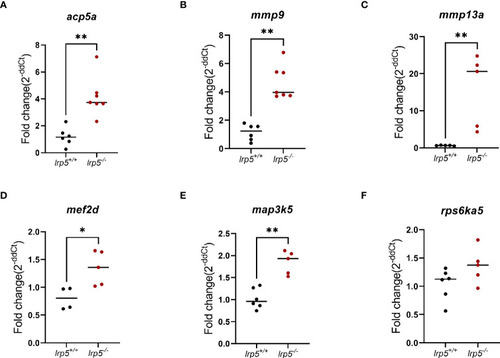
RT-qPCR validation of RNA-Seq data. Genes relevant to osteoclasts activity |
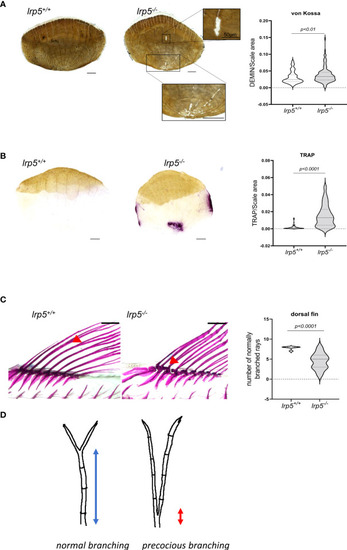
lrp5-/- scales display a larger demineralized area and TRAP positive area. PHENOTYPE:
|