
- Title
-
Acute and Chronic Effects of Fin Amputation on Behavior Performance of Adult Zebrafish in 3D Locomotion Test Assessed with Fractal Dimension and Entropy Analyses and Their Relationship to Fin Regeneration
- Authors
- Audira, G., Suryanto, M.E., Chen, K.H., Vasquez, R.D., Roldan, M.J.M., Yang, C.C., Hsiao, C.D., Huang, J.C.
- Source
- Full text @ Biology (Basel)
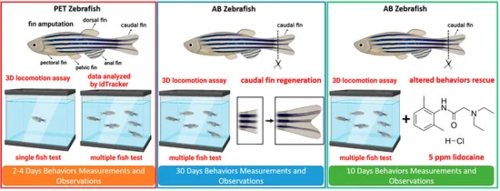
Figure 1. Overview of the experimental design of the current study. In the first section, each fin of the zebrafish was amputated, and the behavior performances of the amputated fishes were assessed in the 3D locomotion test individually and in a group. In the next section, one of the fins that affected the zebrafish behavior performance most was chosen as the fin of interest to evaluate the relation between behavior recovery and fin regeneration in zebrafish. Lastly, we observed the effect of lidocaine to help the fish recover their behaviors after the amputation. |
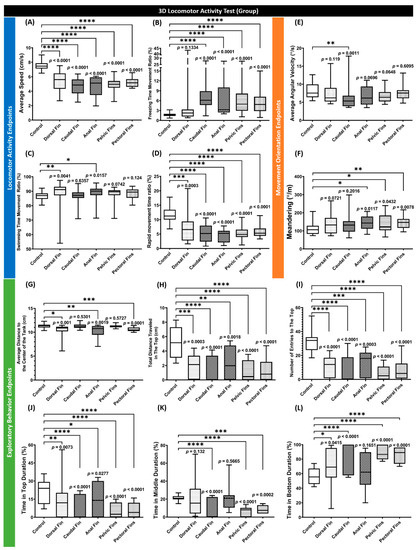
Figure 2. Comparison of grouped zebrafish behaviors in 3D locomotion test among fin-amputated groups and a control group (shoal size = six fishes) at 2 dpa. Twelve endpoints were measured and categorized into three groups. (A) Average speed, (B) freezing time movement ratio, (C) swimming time movement ratio, and (D) rapid movement time ratio belongs to the locomotor activity endpoints group, while the movement orientation endpoints group consists of (E) average angular velocity and (F) meandering. Finally, the exploratory behavior endpoints group is composed of (G) average distance to the center of the tank, (H) total distance traveled in the top, (I) number of entries to the top, (J) time in top duration, (K) time in middle duration, and (L) time in bottom duration. Data are presented as box and whiskers (min to max) and were analyzed by Kruskal–Wallis test continued with uncorrected Dunn’s test (n = 18; * p < 0.05, ** p < 0.01, *** p < 0.001, **** p < 0.0001). |
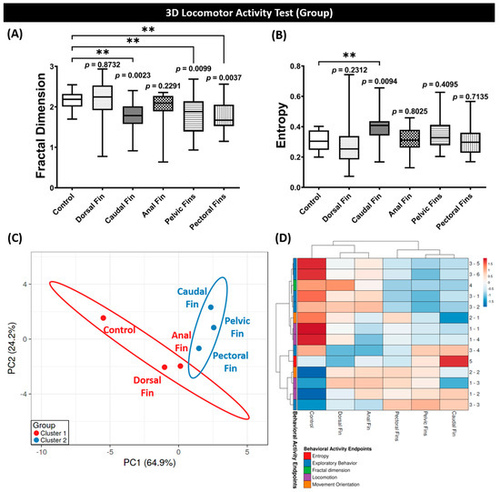
Figure 3. (A) Fractal dimension and (B) entropy analyses of grouped zebrafish (shoal size = six fishes) swimming patterns in 3D locomotion test at 2 dpa. Data are presented as box and whiskers (min to max) and were analyzed by Kruskal–Wallis test continued with uncorrected Dunn’s test (n = 18; ** p < 0.01). (C) Principal component analysis (PCA) and (D) hierarchical clustering analysis of multiple behavior activity endpoints in zebrafish after the fin was amputated. The non-amputated group is included as the control group. In Figure 2C, two major clusters from hierarchical clustering analysis results are marked with red (cluster 1) and blue (cluster 2) colors. |
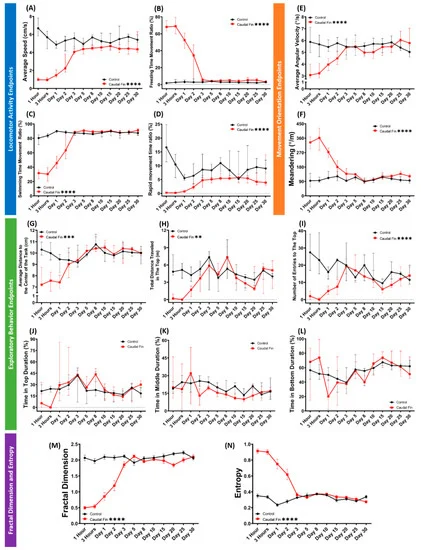
Figure 4. Comparison of grouped zebrafish behaviors in 3D locomotion test between caudal fin-amputated (red) and untreated (black) groups (shoal size = six fishes) during 30 days of observation. Twelve endpoints were measured and categorized into three groups. (A) Average speed, (B) freezing time movement ratio, (C) swimming time movement ratio, and (D) rapid movement time ratio belong to the locomotor activity endpoints group, while the movement orientation endpoints group consists of (E) average angular velocity and (F) meandering. Finally, the exploratory behavior endpoints group is composed of (G) average distance to the center of the tank, (H) total distance traveled in the top, (I) number of entries to the top, (J) time in top duration, (K) time in middle duration, and (L) time in bottom duration. In addition, (M) fractal dimension and (N) entropy analyses between groups are also added. Data from Figure 4A–L are expressed in the median with 95% CI, while Figure 4M,N are expressed in the mean with SEM. All data were analyzed by mixed models two-way ANOVA continued with Sidak’s multiple comparisons test (n = 18, except for caudal-fin-amputated group on day 25–30 (n = 17); ** p < 0.01, *** p < 0.001, **** p < 0.0001). |
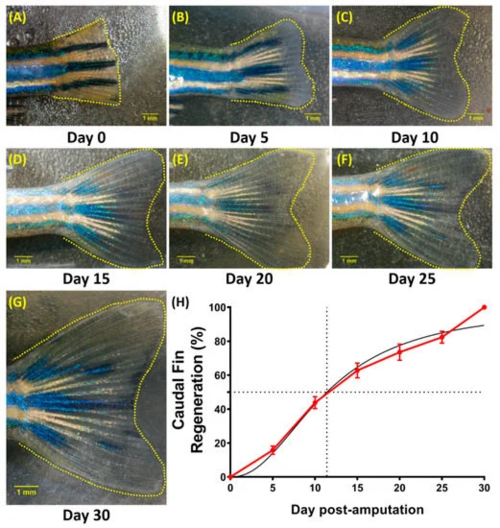
Figure 5. Representative images of a caudal fin regeneration from a single fish at (A) 0, (B) 5, (C) 10, (D) 15 (E) 20 (F) 25, and (G) 30 days post-amputation. (H) Caudal fin regeneration curve during 30-day observation (red line) with the mathematical model of regeneration percentage prediction (normalized) (black line), which indicates that 50% of regeneration occurred approximately 11 days after the amputation. The data are expressed as the mean with SEM (n = 18). |
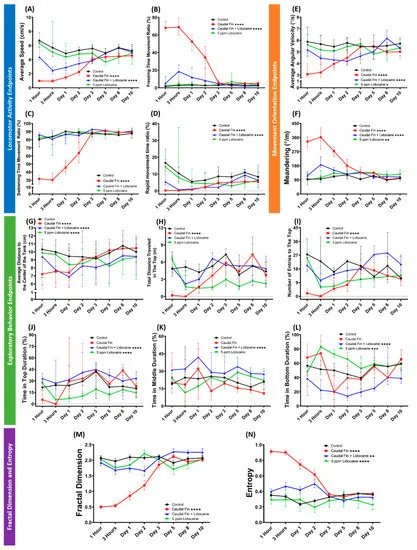
Figure 6. Comparison of grouped zebrafish behaviors in 3D locomotion test between caudal-fin-amputated group (red), caudal-fin-amputated + 5 ppm lidocaine group (blue), 5 ppm lidocaine-treated group (green), and untreated (black) group (shoal size = six fishes) over 10 days observation. Twelve endpoints were measured and categorized into three groups. (A) Average speed, (B) freezing time movement ratio, (C) swimming time movement ratio, and (D) rapid movement time ratio belong to the locomotor activity endpoints group, while the movement orientation endpoints group consists of (E) average angular velocity and (F) meandering. Finally, the exploratory behavior endpoints group is composed of (G) average distance to the center of the tank, (H) total distance traveled in the top, (I) number of entries to the top, (J) time in top duration, (K) time in middle duration, and (L) time in bottom duration. In addition, (M) fractal dimension and (N) entropy analyses between groups are also added. Data from Figure 6A–L are expressed in the median with 95% CI, while Figure 6M,N are expressed in the mean with SEM. All data were analyzed by mixed models two-way ANOVA continued with Sidak’s multiple comparisons test (n = 18, except for the caudal-fin-amputated + lidocaine group on day 2–3 (n =17) and 5–10 (n = 16) and lidocaine-treated group on day 5 (n =17) and 8–10 (n = 16); ** p < 0.01, *** p < 0.001, **** p < 0.0001). |