
|
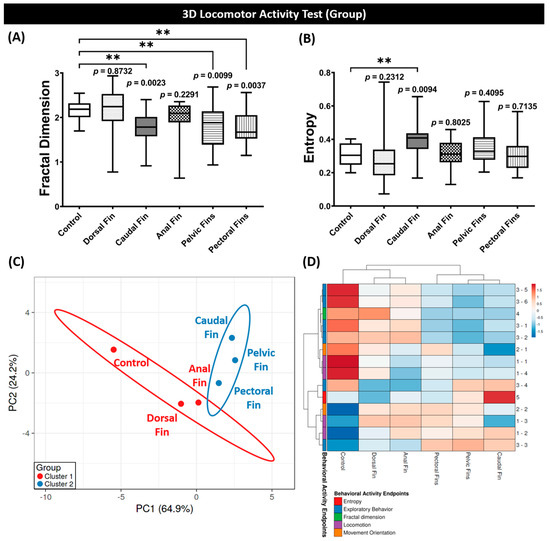
Fig. 3 Figure 3. (A) Fractal dimension and (B) entropy analyses of grouped zebrafish (shoal size = six fishes) swimming patterns in 3D locomotion test at 2 dpa. Data are presented as box and whiskers (min to max) and were analyzed by Kruskal–Wallis test continued with uncorrected Dunn’s test (n = 18; ** p < 0.01). (C) Principal component analysis (PCA) and (D) hierarchical clustering analysis of multiple behavior activity endpoints in zebrafish after the fin was amputated. The non-amputated group is included as the control group. In Figure 2C, two major clusters from hierarchical clustering analysis results are marked with red (cluster 1) and blue (cluster 2) colors.