
|
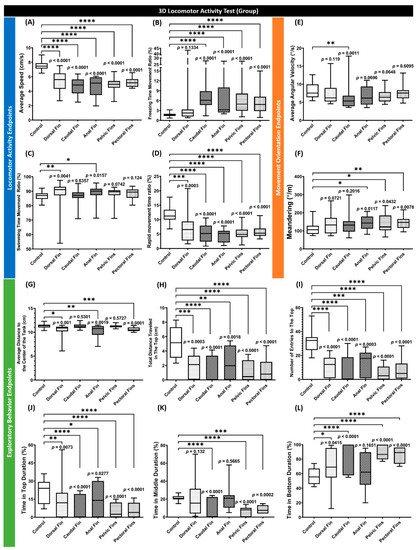
Fig. 2 Figure 2. Comparison of grouped zebrafish behaviors in 3D locomotion test among fin-amputated groups and a control group (shoal size = six fishes) at 2 dpa. Twelve endpoints were measured and categorized into three groups. (A) Average speed, (B) freezing time movement ratio, (C) swimming time movement ratio, and (D) rapid movement time ratio belongs to the locomotor activity endpoints group, while the movement orientation endpoints group consists of (E) average angular velocity and (F) meandering. Finally, the exploratory behavior endpoints group is composed of (G) average distance to the center of the tank, (H) total distance traveled in the top, (I) number of entries to the top, (J) time in top duration, (K) time in middle duration, and (L) time in bottom duration. Data are presented as box and whiskers (min to max) and were analyzed by Kruskal–Wallis test continued with uncorrected Dunn’s test (n = 18; * p < 0.05, ** p < 0.01, *** p < 0.001, **** p < 0.0001).