
|
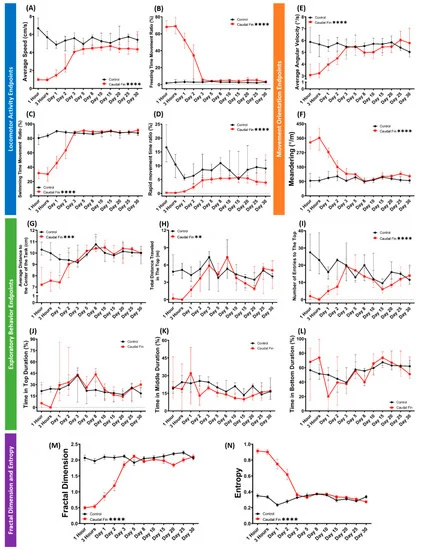
Fig. 4 Figure 4. Comparison of grouped zebrafish behaviors in 3D locomotion test between caudal fin-amputated (red) and untreated (black) groups (shoal size = six fishes) during 30 days of observation. Twelve endpoints were measured and categorized into three groups. (A) Average speed, (B) freezing time movement ratio, (C) swimming time movement ratio, and (D) rapid movement time ratio belong to the locomotor activity endpoints group, while the movement orientation endpoints group consists of (E) average angular velocity and (F) meandering. Finally, the exploratory behavior endpoints group is composed of (G) average distance to the center of the tank, (H) total distance traveled in the top, (I) number of entries to the top, (J) time in top duration, (K) time in middle duration, and (L) time in bottom duration. In addition, (M) fractal dimension and (N) entropy analyses between groups are also added. Data from Figure 4A–L are expressed in the median with 95% CI, while Figure 4M,N are expressed in the mean with SEM. All data were analyzed by mixed models two-way ANOVA continued with Sidak’s multiple comparisons test (n = 18, except for caudal-fin-amputated group on day 25–30 (n = 17); ** p < 0.01, *** p < 0.001, **** p < 0.0001).