
Image
|
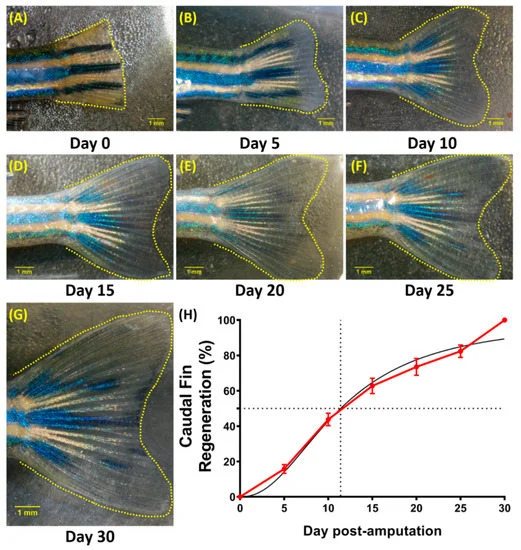
Figure Caption
Fig. 5 Figure 5. Representative images of a caudal fin regeneration from a single fish at (A) 0, (B) 5, (C) 10, (D) 15 (E) 20 (F) 25, and (G) 30 days post-amputation. (H) Caudal fin regeneration curve during 30-day observation (red line) with the mathematical model of regeneration percentage prediction (normalized) (black line), which indicates that 50% of regeneration occurred approximately 11 days after the amputation. The data are expressed as the mean with SEM (n = 18).
Acknowledgments
This image is the copyrighted work of the attributed author or publisher, and
ZFIN has permission only to display this image to its users.
Additional permissions should be obtained from the applicable author or publisher of the image.
Full text @ Biology (Basel)