
- Title
-
GCAF(TMEM251) regulates lysosome biogenesis by activating the mannose-6-phosphate pathway
- Authors
- Zhang, W., Yang, X., Li, Y., Yu, L., Zhang, B., Zhang, J., Cho, W.J., Venkatarangan, V., Chen, L., Burugula, B.B., Bui, S., Wang, Y., Duan, C., Kitzman, J.O., Li, M.
- Source
- Full text @ Nat. Commun.

a A schematic representation of the reporter construct. b CHX chase assay of stably expressed GFP-RNF152 and mCherry in HEK293 cells. c Quantification of the protein levels in b. Mean of 3 independent replicates is shown. Error bars represent standard deviation. d A schematic representation of the CRISPR-Cas9 screen to identify genes essential for lysosome function. e Flow cytometry profiles of presorted and sorted cells from the CRISPR-Cas9 screen with or without CHX treatment. f A schematic representation of hits from the CRISPR-Cas9 screen that highlights the membrane trafficking pathways (Created with BioRender.com). Black: hits from the first-round sorting. Orange: hits from the second-round sorting. Red: hits appeared in both rounds of sorting. g Top 10 hits of Illumina sequencing of sgRNAs from the second round of sorting. |

a CHX chase assay of stably expressed GFP-RNF152 in sgRNA control, sgRNA-1 TMEM251, and sgRNA-2 TMEM251 cells. b Steady-state (0 h) protein levels in a. Mean of 3 independent replicates is shown. Error bars represent standard deviation. **p ≤ 0.01, ***p ≤ 0.001. c Quantification of GFP-RNF152 degradation in a. Mean of 3 independent replicates is shown. Error bars represent standard deviation. *p ≤ 0.05, **p ≤ 0.01, ***p ≤ 0.001. Table: Calculated protein half-lives. d CHX chase assay of endogenous LAPTM4A in sgRNA control, sgRNA-1 TMEM251, and sgRNA-2 TMEM251 cells. Arrowhead: cleavage product of LAPTM4A. e Steady-state (0 h) LAPTM4A protein levels in d. Mean of 3 independent replicates is shown. Error bars represent standard deviation. **p ≤ 0.01, ***p ≤ 0.001. f Quantification of LAPTM4A degradation in d, Mean of 3 independent replicates is shown. Error bars represent standard deviation. **p ≤ 0.01. Table: Calculated protein half-lives. g EGFR degradation assay in HeLa WT and TMEM251 KO cells. h Quantification of EGFR degradation in g. Mean of 3 independent replicates is shown. Error bars represent standard deviation. *p ≤ 0.05. Table: Calculated protein half-lives. i p62 and LC3B protein levels in HEK293 WT and sgTMEM251 cells. j, k Quantification of the p62 (j) and LC3B-II (k) protein levels in (i). Mean of 3 independent replicates is shown. Error bars represent standard deviation. *p ≤ 0.05. **p ≤ 0.01. See source data file for exact P values. |

a, b Lysotracker intensity of WT vs. sgTMEM251 in HeLa (a) and HEK293 (b) cells. c Representative TEM images of HeLa WT (n = 100) and sgTMEM251 (n = 100) cells. Scale bar: 2 µm. d Representative zoomed-in TEM images of lysosomes in HeLa WT (n = 100) and sgTMEM251 (n = 100) cells. Scale bar: 0.2 µm. e Quantification of lysosome radius in HeLa WT (n = 131) and sgTMEM251 (n = 297) cells. Mean of the quantification is shown with error bars representing the standard deviation. ****p ≤ 0.0001. See source data file for exact P values. f Metascape Gene Ontology (GO) cellular component analysis of differentially expressed genes (DEGs) altered in sgTMEM251 (n = 3 independent replicates) vs. control (n = 3 independent replicates) cells. The number of genes in each pathway is indicated. g Volcano plot of RNA-seq analysis of sgTMEM251 (n = 3 independent replicates) vs. control (n = 3 independent replicates) cells. Annotated genes are classified in lysosome/lytic vacuole components. h Heatmap of genes annotated in g. |
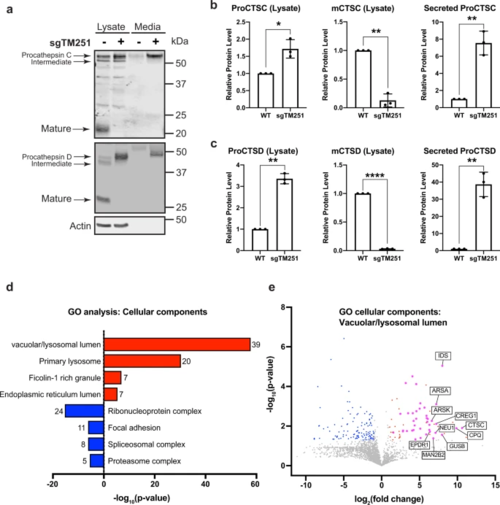
a CTSC and CTSD protein level in the whole cell lysate and conditioned media of HEK293 WT and sgTMEM251 cells. b, c Quantification of CTSC and CTSD protein levels in a. Mean of 3 independent replicates is shown. Error bars represent standard deviation. *p ≤ 0.05, **p ≤ 0.01, ****p ≤ 0.0001. See source data file for exact P values. d GO enrichment analysis of secreted proteins altered in sgTMEM251 (n = 3 independent replicates) vs. control (n = 3 independent replicates) cells. The number of proteins in each pathway is indicated. e Volcano plot of secretome analysis of sgTMEM251 (n = 3 independent replicates) vs. control (n = 3 independent replicates) cells. Annotated genes are the top 10 candidates in vacuolar/lysosomal lumenal components. |
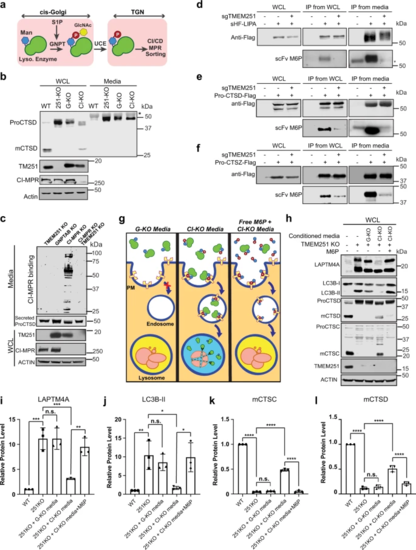
a A schematic representation of M6P modification and sorting of lysosomal enzymes. b CTSD protein level in the whole cell lysate and conditioned media of HEK293T WT, TMEM251 KO (251-KO), GNPTAB KO (G-KO), CI-MPR KO (CI-KO) cells (n = 3 independent replicates). Asterisk: a non-specific band. c CI-MPR binding assay of conditioned media from TMEM251 KO, GNPTAB KO, CI-MPR KO, and CI-MPR and TMEM251 double KO cells (n = 3 independent replicates). d–f Detection of M6P modification of LIPA (d), CTSD (e), and CTSZ (f) in HEK293T and sgTMEM251 cells (n = 2 independent replicates) using single-chain antibodies against M6P (scFv M6P). Asterisk: a non-specific band. g, h Rescue of TMEM251 KO with conditioned media from GNPTAB KO and CI-MPR KO cells. i–l Quantification of the full-length LAPTM4A, LC3B-II, mature CTSC, and mature CTSD protein levels in h. Mean of 3 independent replicates is shown. Error bars represent standard deviation. *p ≤ 0.05, **p ≤ 0.01, ***p ≤ 0.001, ****p ≤ 0.0001. See source data file for exact P values. |
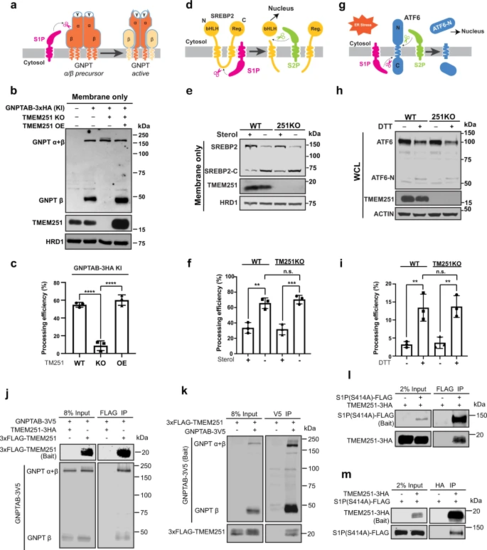
a A schematic representation of GNPTAB processing by S1P. b The processing of the endogenously tagged GNPTAB in TMEM251 KO and TMEM251 overexpression (OE) cells. c Quantification of the GNPTAB processing efficiency in b. Mean of 3 independent replicates is shown. Error bars represent standard deviation. ****p ≤ 0.0001. d A schematic representation of SREBP2 processing by S1P and S2P. e The processing of SREBP2 in HEK293T WT and TMEM251 KO cells. f Quantification of the SREBP2 processing efficiency in e. Mean of 3 independent replicates is shown. Error bars represent standard deviation. **p ≤ 0.01, ***p ≤ 0.001. g A schematic representation of ATF6 processing by S1P and S2P. h ATF6 processing in HEK293T WT and TMEM251 KO cells after 1 h of CHX and DTT treatment. i Quantification of the ATF6 processing efficiency in (h). Mean of 3 independent replicates is shown. Error bars represent standard deviation. **p ≤ 0.01. See source data file for exact P values. j, k Reciprocal IP (n = 2 independent replicates) showing interactions between GNPTAB and TMEM251. l, m Reciprocal IP (n = 2 independent replicates) showing interactions between S1P (S414A) and TMEM251. |
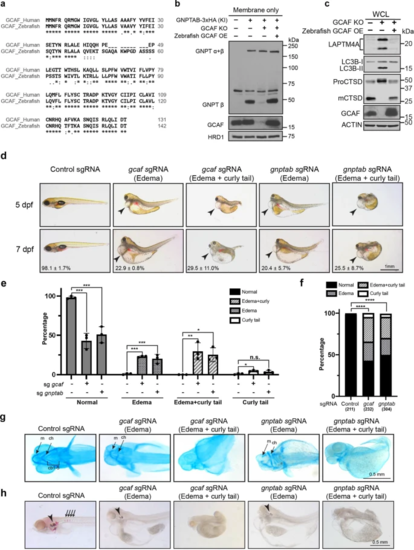
a Sequence alignments of human GCAF short isoform and zebrafish GCAF. b Zebrafish GCAF rescued the GNPTAB processing defects in GCAF KO HEK293T cells (n = 3 independent replicates). c Zebrafish GCAF rescued the lysosome function in GCAF KO HEK293T cells (n = 3 independent replicates). d Morphology of the F0 GCAF and GNPTAB deficient fish at 5 and 7 dpf. Arrowheads point to heart edema. e Quantification of morphological phenotypes observed in d. Mean of 3 independent replicates is shown. Error bars represent standard deviation. *p ≤ 0.05, **p ≤ 0.01, ***p ≤ 0.001. See source data file for exact P values. f χ2 test to compare control, sgGCAF, and sgGNPTAB embryos. ****p ≤ 0.0001. The numbers in x-axis represent the fishes included in the quantification. g Ventral view of alcian blue stained zebrafish larvae at 4 dpf. ch: ceratohyal, m: Meckel’s cartilage; cb: ceratobranchials. h Alizarin red staining of zebrafish embryos at 7 dpf. Arrowheads: ear stones. Arrows: vertebrate columns. |
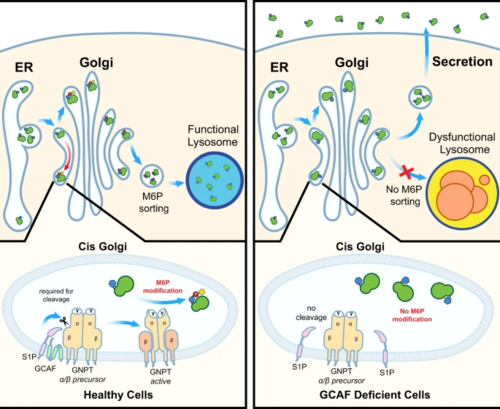
TMEM251/GCAF deficiency leads to defects in M6P modification of lysosomal enzymes at the cis-Golgi. Lysosomal enzymes without M6P are targeted to the secretory pathway, resulting in lysosome dysfunction. |