
|
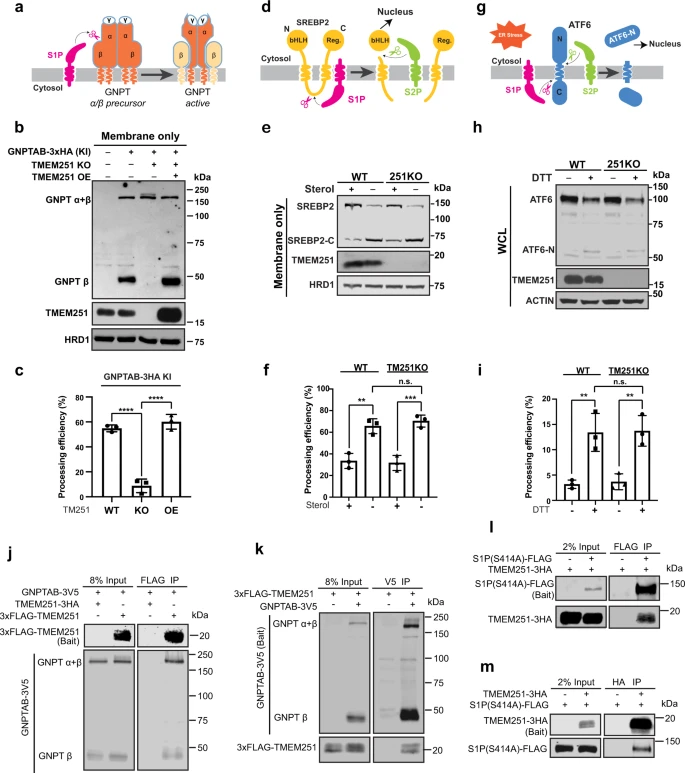
Fig. 6
a A schematic representation of GNPTAB processing by S1P. b The processing of the endogenously tagged GNPTAB in TMEM251 KO and TMEM251 overexpression (OE) cells. c Quantification of the GNPTAB processing efficiency in b. Mean of 3 independent replicates is shown. Error bars represent standard deviation. ****p ≤ 0.0001. d A schematic representation of SREBP2 processing by S1P and S2P. e The processing of SREBP2 in HEK293T WT and TMEM251 KO cells. f Quantification of the SREBP2 processing efficiency in e. Mean of 3 independent replicates is shown. Error bars represent standard deviation. **p ≤ 0.01, ***p ≤ 0.001. g A schematic representation of ATF6 processing by S1P and S2P. h ATF6 processing in HEK293T WT and TMEM251 KO cells after 1 h of CHX and DTT treatment. i Quantification of the ATF6 processing efficiency in (h). Mean of 3 independent replicates is shown. Error bars represent standard deviation. **p ≤ 0.01. See source data file for exact P values. j, k Reciprocal IP (n = 2 independent replicates) showing interactions between GNPTAB and TMEM251. l, m Reciprocal IP (n = 2 independent replicates) showing interactions between S1P (S414A) and TMEM251.