
|
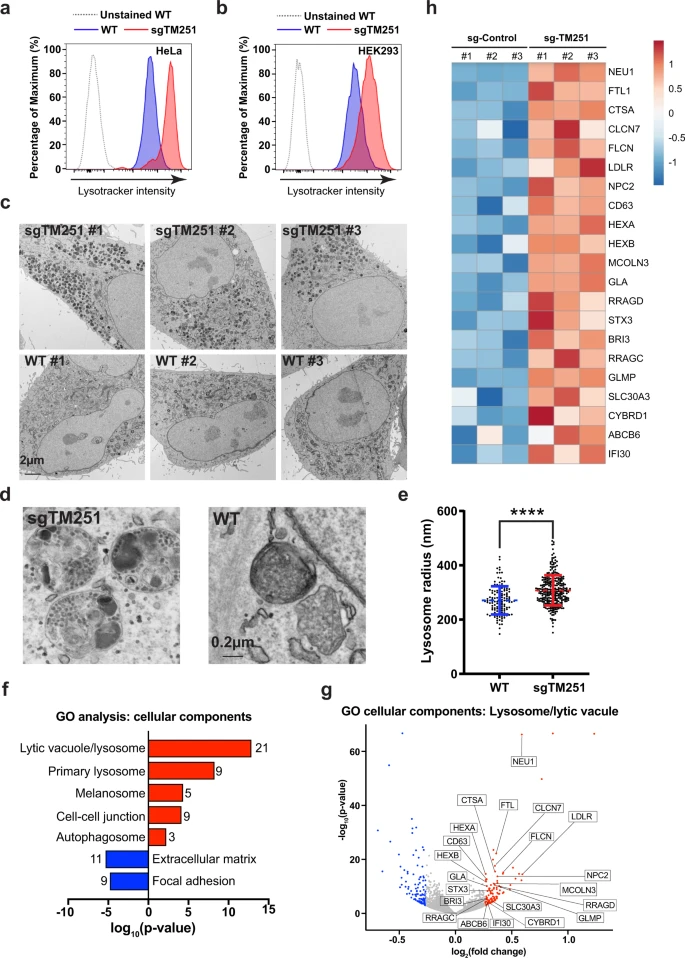
Fig. 3
a, b Lysotracker intensity of WT vs. sgTMEM251 in HeLa (a) and HEK293 (b) cells. c Representative TEM images of HeLa WT (n = 100) and sgTMEM251 (n = 100) cells. Scale bar: 2 µm. d Representative zoomed-in TEM images of lysosomes in HeLa WT (n = 100) and sgTMEM251 (n = 100) cells. Scale bar: 0.2 µm. e Quantification of lysosome radius in HeLa WT (n = 131) and sgTMEM251 (n = 297) cells. Mean of the quantification is shown with error bars representing the standard deviation. ****p ≤ 0.0001. See source data file for exact P values. f Metascape Gene Ontology (GO) cellular component analysis of differentially expressed genes (DEGs) altered in sgTMEM251 (n = 3 independent replicates) vs. control (n = 3 independent replicates) cells. The number of genes in each pathway is indicated. g Volcano plot of RNA-seq analysis of sgTMEM251 (n = 3 independent replicates) vs. control (n = 3 independent replicates) cells. Annotated genes are classified in lysosome/lytic vacuole components. h Heatmap of genes annotated in g.