
- Title
-
Tankyrase Inhibition Attenuates Cardiac Dilatation and Dysfunction in Ischemic Heart Failure
- Authors
- Wang, H., Segersvärd, H., Siren, J., Perttunen, S., Immonen, K., Kosonen, R., Chen, Y.C., Tolva, J., Laivuori, M., Mäyränpää, M.I., Kovanen, P.T., Sinisalo, J., Laine, M., Tikkanen, I., Lakkisto, P.
- Source
- Full text @ Int. J. Mol. Sci.
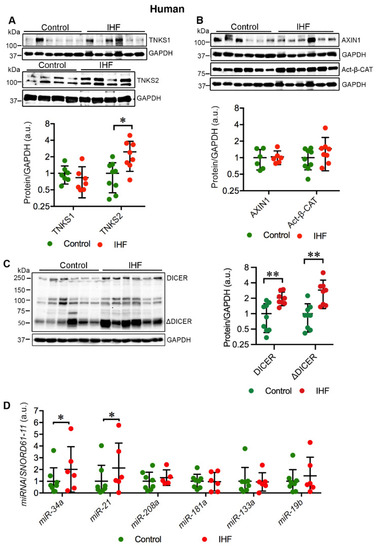
Cardiac TNKS2 and DICER are stabilized in ischemic heart failure (IHF) patients. (A) Representative immunoblots of TNKS1 and TNKS2 in the left ventricle (LV) of IHF and healthy controls. (B) Representative immunoblots of AXIN1 and active β-catenin (Act-β-CAT) in the LV of IHF and healthy controls. (C) Representative immunoblots of DICER and truncated DICER (ΔDICER) in the LV of IHF and healthy controls. The graphs represent quantifications of three replicate blots for the indicated proteins relative to GAPDH. The results are presented as fold change compared to controls. The blurry or oversaturated bands were excluded from the quantification. Controls: TNKS1, n = 7; TNKS2, n = 9; AXIN1, n = 6; Act-β-CAT, n = 9; DICER, n = 9; ΔDICER, n = 9; IHF: TNKS1, n = 7; TNKS2, n = 8; AXIN1, n = 6; Act-β-CAT, n = 8; DICER, n = 8; ΔDICER, n = 8. (D) qRT-PCR analysis of miRNA expression in the LV of IHF patients (n = 6) and healthy controls (n = 8). Data are presented as mean ± SD. Two-sample t-test: * p < 0.05, ** p < 0.01. |
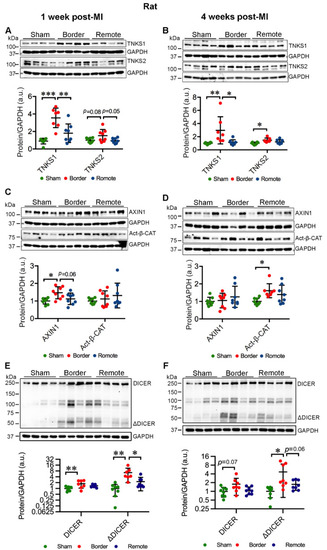
Ischemic injury augments TNKS1 and TNKS2 in the border area in rat hearts. (A,B) Representative immunoblots of TNKS1 and TNKS2 in the remote and border areas in MI rat hearts and sham-operated controls at 1 week (A) and 4 weeks (B) post-MI. (A) Sham: n = 8; MI Border: TNKS1, n = 7; TNKS2, n = 8; MI Remote: n = 8. (B) Sham: n = 8; MI Border: n = 7; MI Remote: n = 8. (C,D) Representative immunoblots of AXIN1 and Act-β-CAT in the remote and border areas in MI rat hearts and sham-operated controls at 1 week (C) and 4 weeks (D) post-MI. (C) Sham: n = 8; MI Border: n = 8; MI Remote: n = 8. (D) Sham: n = 8; MI Border: AXIN1, n = 8; Act-β-CAT, n = 7; MI Remote, n = 8. (E,F) Representative immunoblots of DICER and ΔDICER in the remote and border areas in MI rat hearts and sham-operated controls at 1 week (E) and 4 weeks (F) post-MI. (E,F): Sham, n = 8; MI Border, n = 8; MI Remote, n = 8. The graphs represent quantifications of three replicate blots for the indicated proteins relative to GAPDH. The results are presented as fold change compared to controls. The blurry or oversaturated bands were excluded from the quantification. Data are presented as mean ± SD. One-way ANOVA with Tukey adjustment for multiple comparisons: * p < 0.05, ** p < 0.01, *** p < 0.001. |
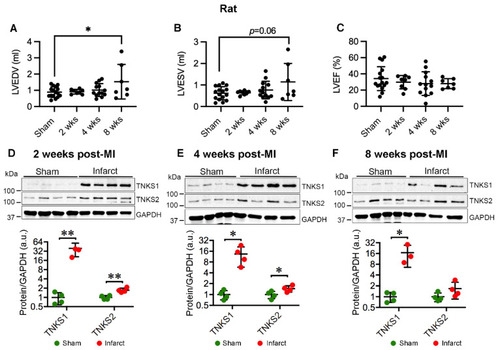
Ischemic injury boosts TNKS1 and TNKS2 in the infarct area in rat hearts. (A,B) Echocardiography depicts increased left ventricular volume at 8 weeks post-MI compared to sham controls as determined by left ventricular end diastolic volume (LVEDV) (A) and left ventricular end systolic volume (LVESV) (B). (C) Left ventricular ejection fraction (LVEF). (D–F) Representative immunoblots of TNKS1 and TNKS2 in the infarct area in MI rat hearts and sham-operated controls at 2 (D), 4 (E), and 8 (F) weeks post-MI. The graphs represent quantifications of three replicate blots for the indicated proteins normalized to GAPDH. The results are presented as fold change compared to controls. The blurry band was excluded from the quantification. (A–C) Sham, n = 16; 2 weeks, n = 8; 4 weeks, n = 13; 8 weeks, n = 7. (D), Sham, n = 4; MI, n = 4. (E) Sham, n = 4; MI, n = 4. (F) Sham, n = 4; MI TNKS1, n = 3; TNKS2, n = 4. Data are presented as mean ± SD. One-way ANOVA with Tukey adjustment for multiple comparisons (A–C); two-sample t-test (D–F); * p < 0.05, ** p < 0.01. |
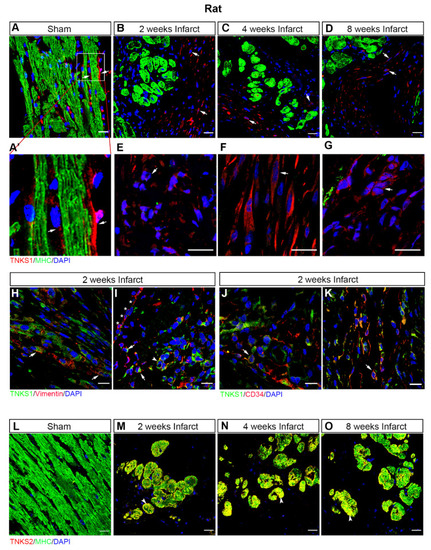
Ischemic injury stimulates TNKS1 in non-cardiomyocytes and TNKS2 in cardiomyocytes in the infarct area in rat hearts. (A–D) Representative immunohistochemical staining of TNKS1 (in red) and MHC (in green) in ventricular sections from sham-operated and MI rat hearts at 2, 4, and 8 weeks post-MI. The TNKS1-positive signal is visualized in the vasculature (arrow) in sham-operated hearts (A,A’) and in non-cardiomyocytes (examples indicated by arrows) in the infarct area at the examined time points (B–D). (A’) Inset: magnified image of TNKS1-positive cells within the vasculature. (E–G) Representative images of immunohistochemical staining showing the TNKS1-positive signal in granulocytes-like cells (E), fibroblasts (F), and endothelium-like cells (G) indicated by the arrow in the infarct area. (H,I) Representative immunohistochemical staining of TNKS1 (in green) and vimentin (in red) showing accumulation of TNKS1 in vimentin-positive fibroblasts (arrow in H), EMT cells (arrow in I), and vascular endothelial cells (arrowhead in I) in the infarct area at 2 weeks post-MI. Stars (* in I) indicate the epicardium. (J,K) Representative immunohistochemical staining of TNKS1 (in green) and CD34 (in red) showing accumulation of TNKS1 in CD34-positive (arrow) vascular endothelial cells (J) and circulating cells (K) in the infarct area at 2 weeks post-MI. (L–O) Representative immunohistochemical staining of TNKS2 (in red) and MHC (in green) in ventricular sections from sham-operated and infarcted rat hearts at 2, 4, and 8 weeks post-MI. The co-localization of TNKS2 and MHC is visualized in cardiomyocytes (arrowhead) in the infarct area at the examined time points. Scale bars: 20 μm. |
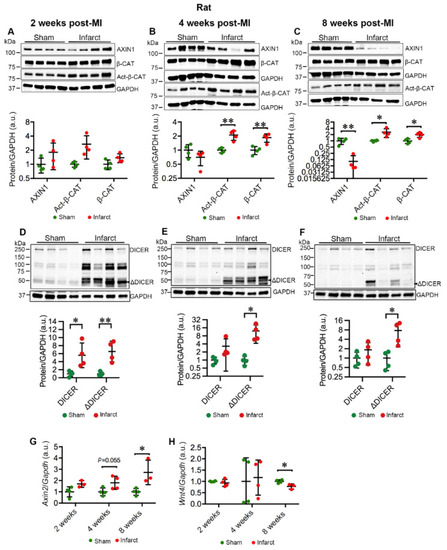
MI destabilizes AXIN1 and activates Wnt/β-catenin signaling in the infarct area in rat hearts. (A–C) Representative immunoblots of AXIN1, total β-catenin (β-CAT), and active β-catenin (Act-β-CAT) in the infarct area in MI rat hearts and sham-operated controls at 2 (A), 4 (B), and 8 (C) weeks post-MI. (D–F) Representative immunoblots of DICER in the infarct area in MI rat hearts and sham-operated controls at 2 (D), 4 (E), and 8 (F) weeks post-MI. The graphs represent quantifications of three replicate blots for the indicated proteins normalized to GAPDH. The results are presented as fold change compared to controls. Sham, n = 4; MI, n = 4. (G,H) qRT-PCR analysis of Axin2 (G) and Wnt4 (H) in the infarct area of MI rats and sham-operated controls. Axin2: Sham, n = 4; MI 2 and 8 weeks, n = 3; 4 weeks, n = 4; Wnt4: Sham, n = 4; MI 2 and 4 weeks, n = 4; 8 weeks, n = 3. Data are presented as mean ± SD. Two-sample t-test: * p < 0.05, ** p < 0.01. |
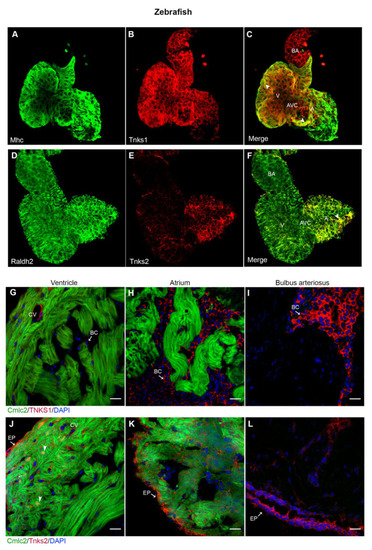
Tnks1 and Tnks2 display a distinct expression pattern in zebrafish developing and adult hearts. (A–C) Confocal images of whole-mount immunostaining for Mhc (A) and Tnks1 (B) in dissected zebrafish heart at 4 dpf. Tnks1 is co-expressed with Mhc in the ventricle (arrowhead) and atrium (arrowhead): A, atrium; V, ventricle; BA, bulbus arteriosus; AVC, atrioventricular canal. (D–F) Representative confocal images of whole-mount immunostaining for Raldh2 (D) and Tnks2 (E) in dissected zebrafish heart at 4 dpf. Tnks2 is co-expressed with Radldh2 in the epicardium (arrowhead). (G–I) Representative immunostaining of adult heart sections from transgenic zebrafish Tg(cmlc2:GFP) for Tnks1 (in red) in ventricle (G), atrium (H), and bulbus arteriosus (I). The Tnks1-positive signal is seen in the coronary vasculature (CV) and blood cell (BC) in the lumen. (J–L) Representative immunostaining of adult heart sections from transgenic zebrafish Tg(cmlc2:eGFP) for Tnks2 (in red) in ventricle (J), atrium (K), and bulbus arteriosus (L). The Tnks2-positive signal is seen in the epicardium (EP), the nucleus of the trabecular and cortical cardiomyocytes (arrowhead), and the coronary vasculature (CV). Scale bars: 20 μm. |
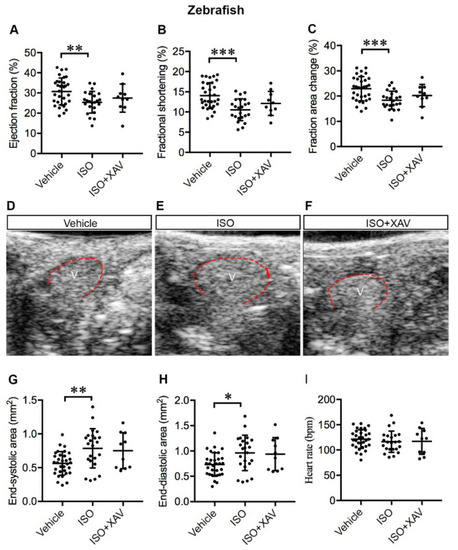
Tnks inhibition protects against cardiac dysfunction and ventricle dilatation induced by ISO in adult zebrafish. (A–C) Echocardiography depicts restored systolic function upon XAV939 treatment in ISO-treated hearts as determined by the ejection fraction (A), fractional shortening (B) and fractional area change (C). (D–F) Representative LAX images of adult zebrafish that received vehicle (D), ISO (E), or ISO and XAV939 (F) for 7 days. V: ventricle outlined in red, anterior to the left. (G,H) XAV939 treatment prevents ventricular dilatation as depicted by the preserved end-systolic (G) and end-diastolic (H) areas. (I) Heart rate displays no significant difference between the groups. Vehicle, n = 32; ISO, n = 23; ISO+XAV939, n = 10. Data are presented as mean ± SD. One-way ANOVA with Tukey adjustment for multiple comparisons: * p < 0.05, ** p < 0.01, *** p < 0.001. |
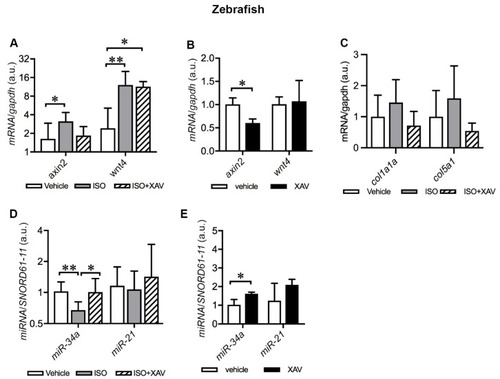
Tnks inhibition amends dysregulation of cardiac Wnt signaling and miRNAs induced by ISO in adult zebrafish. (A) qRT-PCR analysis of axin2 and wnt4 expression in zebrafish hearts treated with ISO alone or together with XAV939 compared to the vehicle. (B) qRT-PCR analysis of axin2 and wnt4 expression in zebrafish hearts treated with XAV939 compared to the vehicle. (C) qRT-PCR analysis of col1a1a and col5a1 expression in zebrafish hearts treated with ISO alone or together with XAV939 compared to the vehicle. (D) qRT-PCR analysis of the expression of selected miRNAs in zebrafish hearts treated with ISO alone or together with XAV9393 compared to the vehicle. (E) qRT-PCR analysis of the expression of the selected miRNAs in zebrafish hearts treated with XAV939 compared to the vehicle. The graphs represent the quantification of two individual analyses of RNA extracts from pooling samples of three hearts. Each analysis includes three replicates. (A,C,D): vehicle, n = 18 hearts; ISO, n = 18 hearts; ISO+XAV939, n = 10 hearts. (B,E): vehicle, n = 10 hearts; XAV939, n = 10 hearts. Data are presented as mean ± SD. One-way ANOVA with Tukey adjustment for multiple comparisons (A,C,D). Two-sample t-test (B,E): * p < 0.05, ** p < 0.01. |