
|
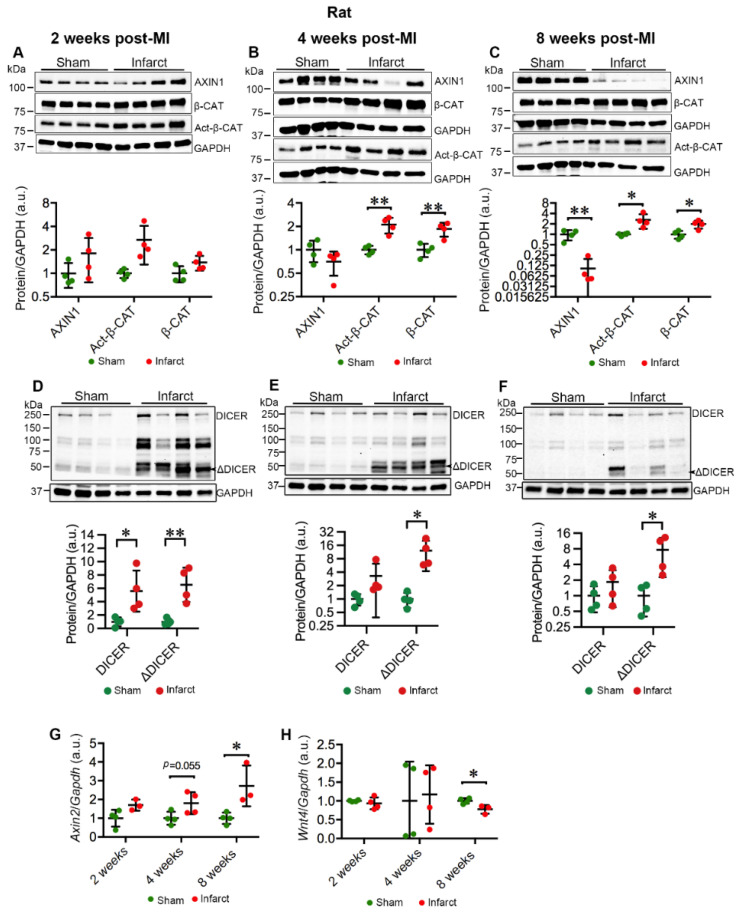
Fig. 5
MI destabilizes AXIN1 and activates Wnt/β-catenin signaling in the infarct area in rat hearts. (A–C) Representative immunoblots of AXIN1, total β-catenin (β-CAT), and active β-catenin (Act-β-CAT) in the infarct area in MI rat hearts and sham-operated controls at 2 (A), 4 (B), and 8 (C) weeks post-MI. (D–F) Representative immunoblots of DICER in the infarct area in MI rat hearts and sham-operated controls at 2 (D), 4 (E), and 8 (F) weeks post-MI. The graphs represent quantifications of three replicate blots for the indicated proteins normalized to GAPDH. The results are presented as fold change compared to controls. Sham, n = 4; MI, n = 4. (G,H) qRT-PCR analysis of Axin2 (G) and Wnt4 (H) in the infarct area of MI rats and sham-operated controls. Axin2: Sham, n = 4; MI 2 and 8 weeks, n = 3; 4 weeks, n = 4; Wnt4: Sham, n = 4; MI 2 and 4 weeks, n = 4; 8 weeks, n = 3. Data are presented as mean ± SD. Two-sample t-test: * p < 0.05, ** p < 0.01.