
- Title
-
Beyond bold versus shy: Zebrafish exploratory behavior falls into several behavioral clusters and is influenced by strain and sex
- Authors
- Rajput, N., Parikh, K., Kenney, J.W.
- Source
- Full text @ Biol. Open
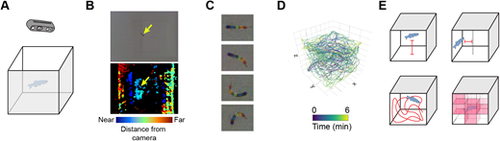
Overview of three-dimensional behavioral tracking. (A) Individual fish were placed into a novel tank while video was recorded from above using D435 Intel RealSense™ cameras. (B) Videos included both a color (top) and a depth (bottom) stream where fish can be seen (yellow arrows). (C) Animals were tracked in the color videos using DeepLabCut to identify five points along the length of the fish. (D) Tracking was overlaid with the depth stream to generate a three-dimensional trace for each animal. (E) Four exploratory parameters were extracted from each trace: bottom distance (top left), center distance (top right), distance travelled (bottom left), and percent of the tank explored (bottom right). |
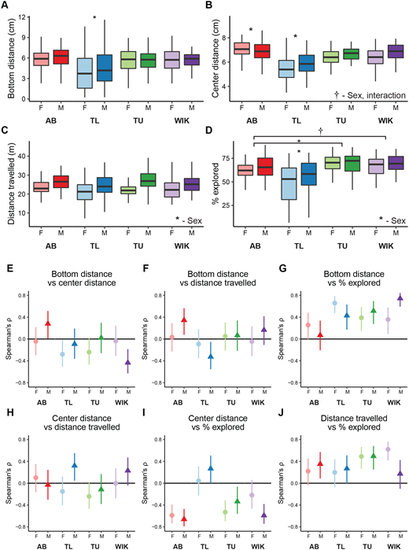
Influence of sex and strain on individual exploratory behaviors. The effect of sex and strain on (A) bottom distance, (B) center distance, (C) distance travelled, and (D) percent of the tank explored. Boxplots indicate median (center line), interquartile range (box ends), and hinge±1.5 times the interquartile range (whiskers). Spearman's rank correlation coefficient (ρ) with 95% confidence intervals across strain and sex for (E) bottom distance versus center distance, (F) bottom distance versus distance travelled, (G) bottom distance versus percent explored, (H) center distance versus distance travelled, (I) center distance versus percent explored, and (J) distance travelled versus percent explored. *P<0.05, †P<0.10 compared to all other groups or those indicated. AB, female: n=58, male: n=52; TL, female: n=54, male: n=50; TU, female: n=58, male: n=50; WIK, female: n=51, male: n=53. |
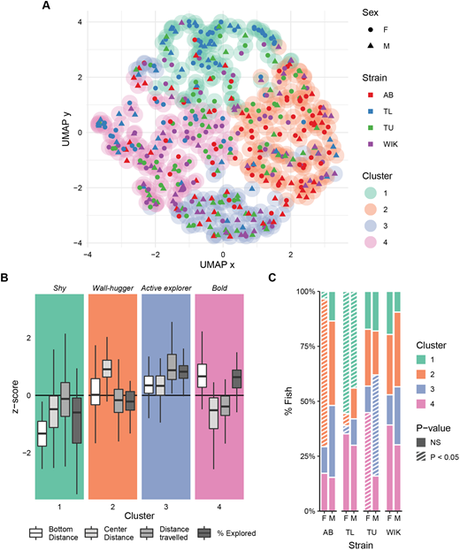
Clustering of zebrafish exploratory behavior during initial exposure to the tank. (A) Two-dimensional representation of the four-dimensional behavioral space using a uniform manifold approximation (McInnes et al., 2020preprint). Clusters (outer circles) are derived from Louvain community finding applied to a k-nearest neighbor network using 426 fish. Each point is an individual fish where the shape represents the sex (circle: female, triangle: male), inner color the strain, and outer color the behavioral cluster. (B) Individual behaviors associated with each cluster as box plots indicating median (center line), interquartile range (box ends), and hinge±1.5 times the interquartile range (whiskers). (C) Percentage of fish that fall into each cluster across strain and sex. Striped bars (P<0.05) represent over/under representation using randomized permutation tests and FDR corrections. AB, female: n=58, male: n=52; TL, female: n=54, male: n=50; TU, female: n=58, male: n=50; WIK, female: n=51, male: n=53. |
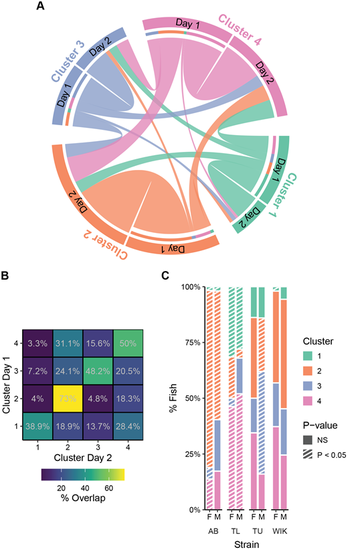
Clusters across two consecutive exposures to the tank. (A) Chord diagram indicating how cluster membership changes from day 1 to day 2 of novel tank exposure. (B) Percent overlap for each cluster from day 1 to day 2. (C) Percentage of fish that fall into each cluster across strain and sex on the second day of exposure to the novel tank. Striped bars (P<0.05) represent over/under representation using randomized permutation tests and FDR corrections. AB, female: n=58, male: n=52; TL, female: n=54, male: n=50; TU, female: n=58, male: n=50; WIK, female: n=51, male: n=53. |
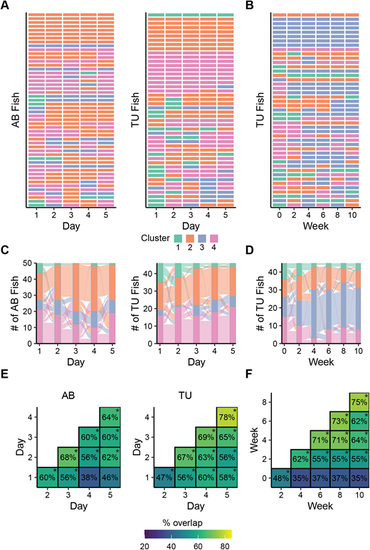
Behavioral consistency of exploratory behavior across days and weeks. (A) Cluster membership of AB (female: n=26, male: n=24) or TU (female: n=21, male: n=25) fish that were exposed to the tank on 5 consecutive days. (B) Cluster membership of TU (female: n=23, male: n=22) fish that were exposed to the tank every other week for 10 weeks. (C) Transitions between clusters across 5 consecutive days of exposure to the tank in AB and TU fish. (D) Transitions between clusters across six biweekly exposures to the tank in TU fish. (E) Percent of overlapping clusters in AB and TU fish across consecutive exposures to the tank across 5 days. (F) Percent overlapping clusters in TU fish across biweekly (every other week) exposures to the tank. *P<0.05 using randomized permutation test and FDR corrections. |
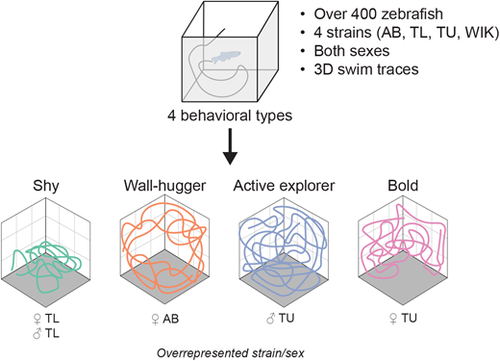
Summary of the findings in the paper along with the strains/sexes of fish that were overrepresented in the different clusters in response to the first exposure to the tank. |