
|
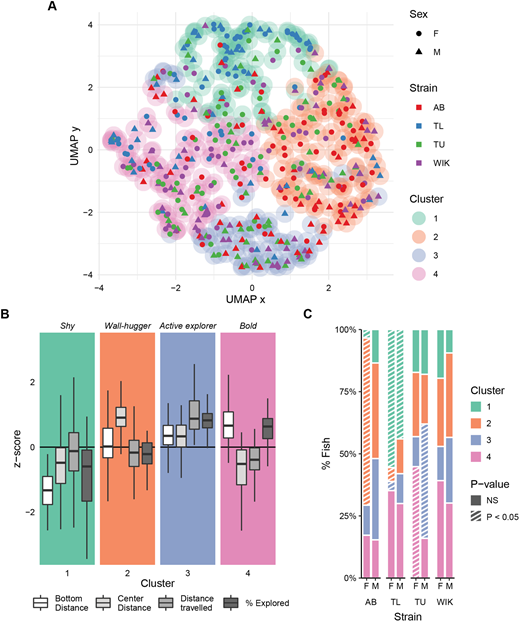
Fig. 3 Clustering of zebrafish exploratory behavior during initial exposure to the tank. (A) Two-dimensional representation of the four-dimensional behavioral space using a uniform manifold approximation (McInnes et al., 2020preprint). Clusters (outer circles) are derived from Louvain community finding applied to a k-nearest neighbor network using 426 fish. Each point is an individual fish where the shape represents the sex (circle: female, triangle: male), inner color the strain, and outer color the behavioral cluster. (B) Individual behaviors associated with each cluster as box plots indicating median (center line), interquartile range (box ends), and hinge±1.5 times the interquartile range (whiskers). (C) Percentage of fish that fall into each cluster across strain and sex. Striped bars (P<0.05) represent over/under representation using randomized permutation tests and FDR corrections. AB, female: n=58, male: n=52; TL, female: n=54, male: n=50; TU, female: n=58, male: n=50; WIK, female: n=51, male: n=53.